
Welcome to the the third publication of the Market’s Compass Weekly Crypto Sweet Sixteen Study. The Study tracks the technical condition of sixteen of the larger market cap cryptocurrencies. I have compiled the historic quantitative objective technical ranking data and secondary technical indicators including the Sweet Sixteen Total Technical Rankings and Weekly Average Technical Ranking back to October of 2021. Every week the Studies will highlight the technical changes of the 16 cryptocurrencies that I track as well as individual highlights on noteworthy moves in certain cryptocurrencies and Indexes.
This will be the last unabridged version that will be sent to free subscribers of my Substack Blog. I hope you found these Studies a useful tactical tool. Please consider becoming a paid subscriber at $12 a month or $100 a year. Paid subscribers also receive my weekly ETF Studies that are published on Mondays. The three ETF Studies track 30 US Index and Sector ETFs, 22 Developed Markets Country ETFs, and 21 Emerging Markets Country ETFs. Also there is a monthly Blog post that covers ENR construction costs and occasional multi-time frame index, commodity and FX technical studies.
The Excel spreadsheet below indicates the weekly change in the objective Technical Ranking (“TR”) of each individual Cryptocurrency. The technical ranking or scoring system is an entirely quantitative approach that utilizes multiple technical considerations that include but are not limited to trend, momentum, measurements of accumulation/distribution and relative strength. If an individual Cryptocurrency’s technical condition improves the Technical Ranking (“TR”) rises, and conversely, if the technical condition continues to deteriorate, the TR falls. The TR of each individual Cryptocurrency can range from 0 to 50. The spreadsheet below also acts as a “heat map” in that, cryptocurrencies with a TR in the range of 1 to 15 are highlighted in red, 15.5 to 34.5 are noted in blue and TRs in the range of 35 to 50 are in green. The primary take-away from this spread sheet should be the trend of the individual TRs, either the continued improvement or deterioration, as well as a change in direction. A sustained trend change needs to unfold in the individual TRs for it to be actionable. Secondarily a very low ranking can signal an oversold condition and conversely a continued very high number can be viewed as an overbought condition but, as we know, over sold conditions can continue at apace and overbought securities that have exhibited extraordinary momentum can easily become more overbought. Thirdly, the weekly TRs are a valuable relative strength/weakness indicator vs. each other, in addition when the Sweet Sixteen Total Technical Ranking (“SSTTR”), that has a range of 0 to 800, is near the bottom of its range and an individual cryptocurrency has a TR that remains elevated it speaks to relative strength. Conversely if the SSTTR is near the top of its recent range and an individual cryptocurrency has a TR that remains mired at low levels it speaks to relative weakness. Lastly I view the objective Technical Rankings as a starting point in my analysis and it is not the entire “end game”.
This Week’s and 10 Week Trailing Technical Rankings of the 16 Individual Cryptocurrencies*
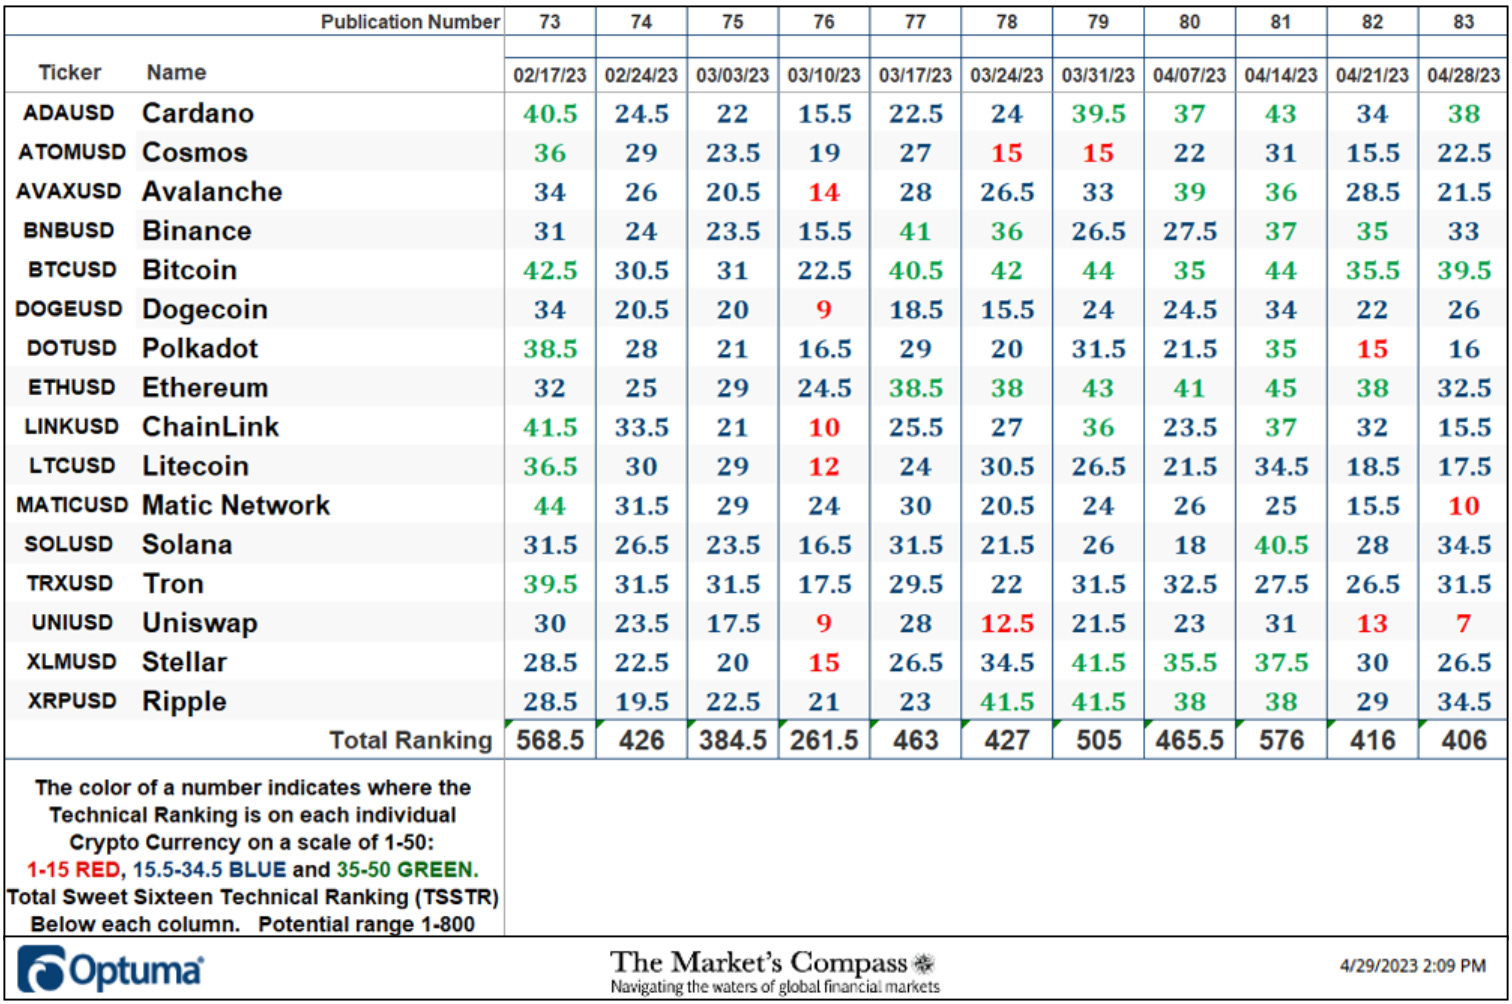
*Rankings are calculated up to Friday April 28th
As can be seen in the spread sheet above there has been a small contraction in the TSSTR. The TSSTR fell to 406 from the previous weeks reading of 416 (chart and further discussion of that technical condition follows later in the Blog).
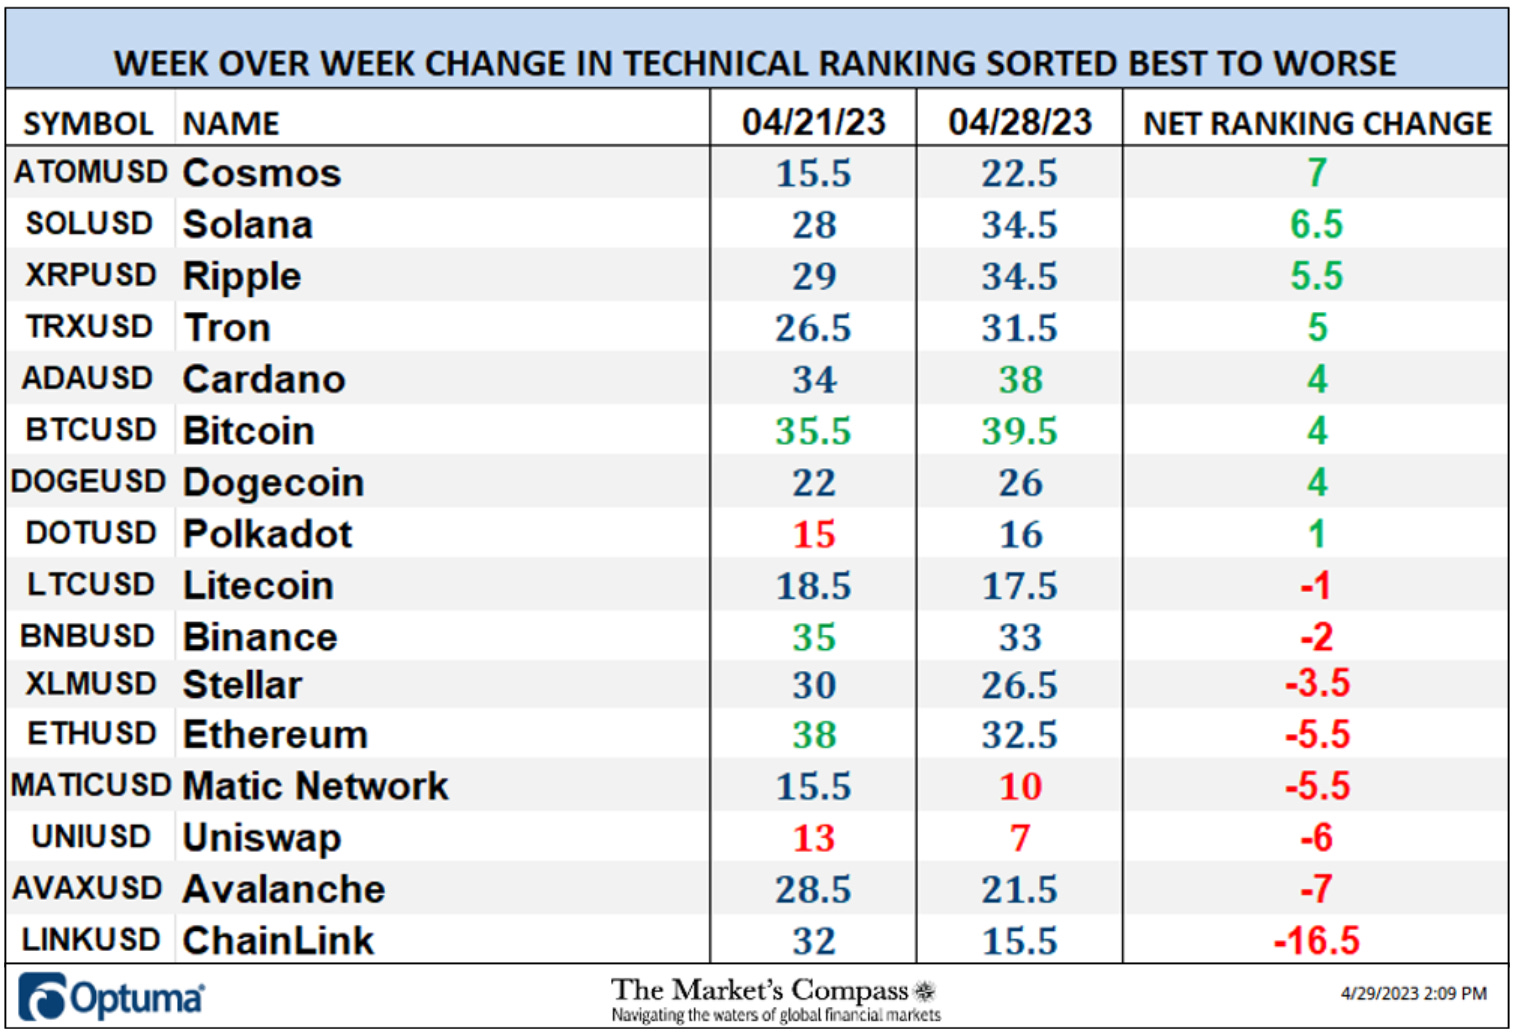
On a Wow basis, eight Cryptocurrencies registered improvement in their objective TRs and eight marked contractions. Two Cryptos ended the week in the “green zone” (TRs of between 35 and 50), twelve are in the “blue zone” (TRs between 15.5 and 34.5) and two ended up in the “red zone” (TRs between 1 and 15). The previous week there were three Crypto’s in the green zone, eleven in the “blue zone” and two in the red zone. Most all TRs ended the week between up +7 and down -7 resulting in a small contraction in the Average TR of -0.63. The one outlier was ChainLink (LINK). It had the most “handles” chopped off its TR by falling -16.5 to 15.5 from 32. Bitcoin (BTC) sported the best technical ranking of the Sweet Sixteen and has been in the green zone for seven weeks running and at the end of last week it also has the best relative strength of the Sweet Sixteen vs. the CCi30 Index*. The Daily Bitcoin chart and comments follow below…
*The CCi30 Index is a registered trademark and was created and is maintained by an independent team of mathematicians, quants and fund managers lead by Igor Rivin. It is is a rules-based index designed to objectively measure the overall growth, daily and long-term movement of the blockchain sector. It does so by indexing the 30 largest cryptocurrencies by market capitalization, excluding stable coins (more details can be found at CCi30.com).
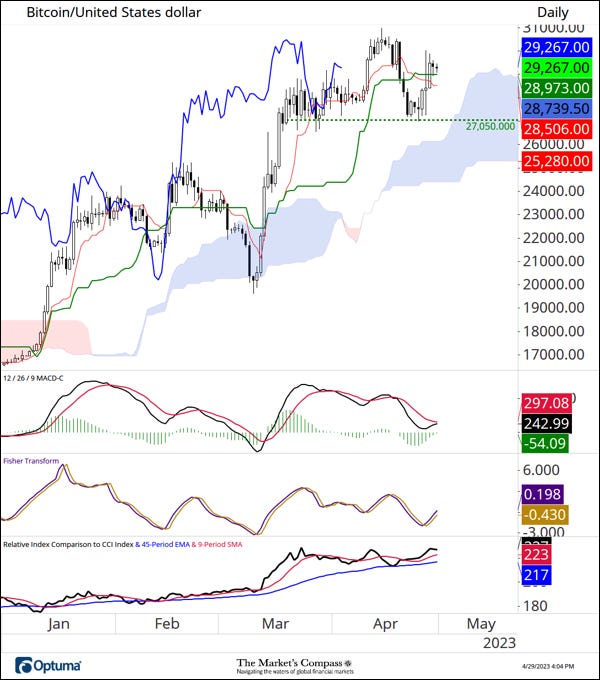
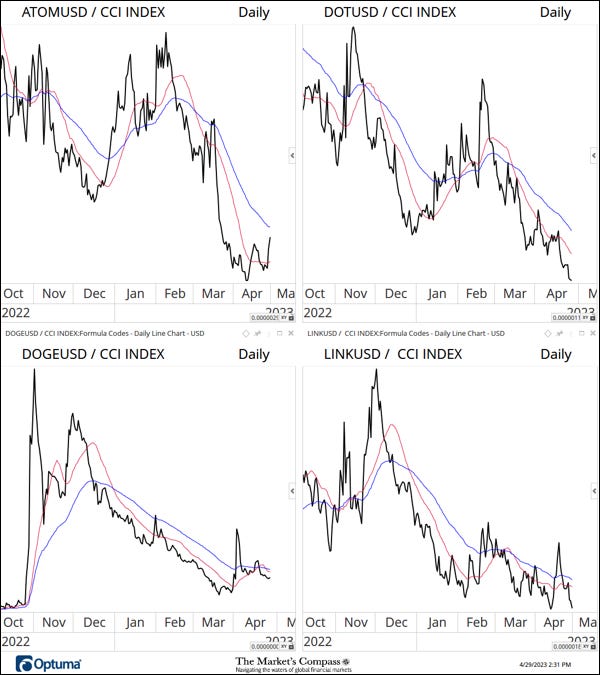
Bitcoin has one of the more “constructive” charts of the sixteen cryptocurrencies we track in the blog. The pullback in price in early February held Cloud support in early March and lifted off again. After reaching the best price level since May of last year BTC traded lower but the “backing and filling” has thus far held key support at 27,050 and has avoided testing Cloud support. MACD is is starting to hook higher and has avoided negative territory and also, note the turn in the Fisher Transform. As can be seen in the lower panel, relative to the CCi30 Index it held support at the longer-term 45-Day EMA (blue line) and is back above the shorter term 9-Day SMA (red line). There may be more “work” to do but I believe if BTC continues to be able to hold key support at 27,050 and the Cloud that there are better than even odds that the April highs will be challenged.
Further Measurements of Relative Strength and Weakness in the Sweet Sixteen
“What’s in Your Wallet?”
A look at the relative strength/weakness of the Crypto Sweet Sixteen versus the CCi30 Index.
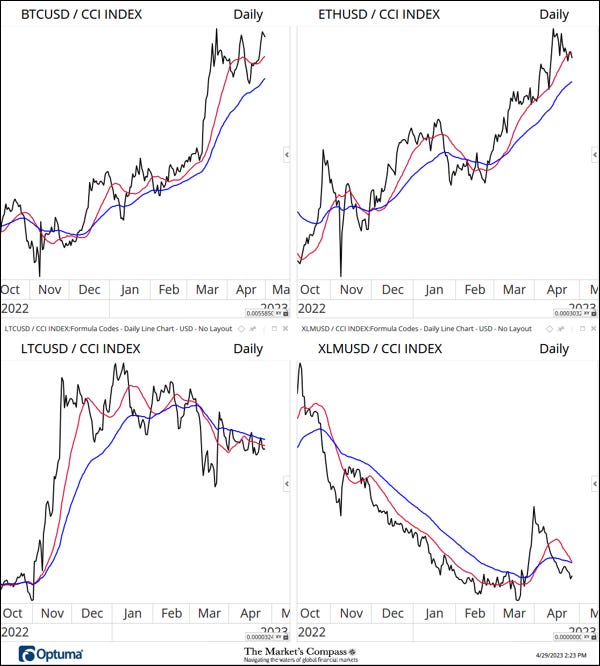

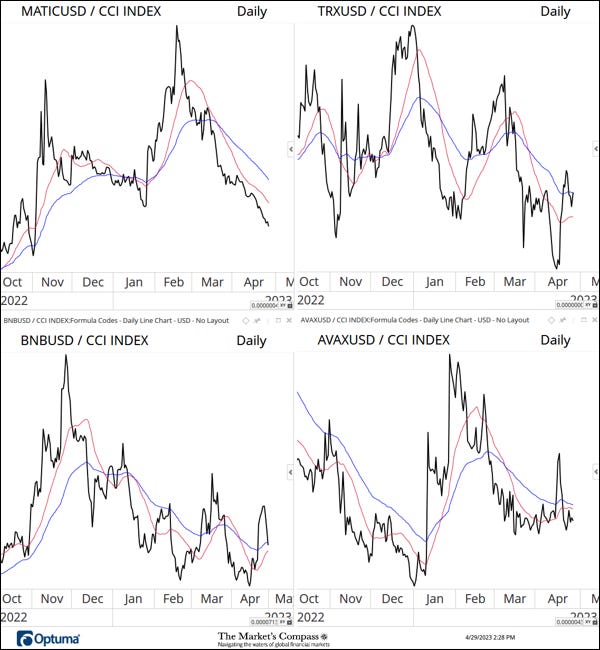
Both Bitcoin (BTC) and Solana (SOL) are showing positive relative strength vs. the CCi30 Index and are tracking higher above both the longer, 55-Day EMA, and shorter term (21-Day SMA) moving averages. Polkadot (DOT) has marked an all-time relative strength low at the end of last week. Uniswap (UNI) marked an eleven month low and Matic Network (MATIC) a new seven month low. All three relative strength lines (or should I say relative weakness lines) are tracking lower below both their moving averages.
Relative Rotation Graph of the Sweet Sixteen
The Relative Rotation Graph, commonly referred to as RRGs were developed in 2004-2005 by Julius de Kempenaer. These charts are a unique visualization tool for relative strength analysis. Chartists can use RRGs to analyze the relative strength trends of several securities against a common benchmark, (in this case the CCi30 Index) and against each other over any given time period (in the case below, daily since the end of the end of last week). The power of RRG is its ability to plot relative performance on one graph and show true rotation. All RRGs charts use four quadrants to define the four phases of a relative trend. The Optuma RRG charts uses, From Leading (in green) to Weakening (in yellow) to Lagging (in pink) to Improving (in blue) and back to Leading (in green). True rotations can be seen as securities move from one quadrant to the other over time. This is only a brief explanation of how to interpret RRG charts. To learn more, see the post scripts and links at the end of this Blog.
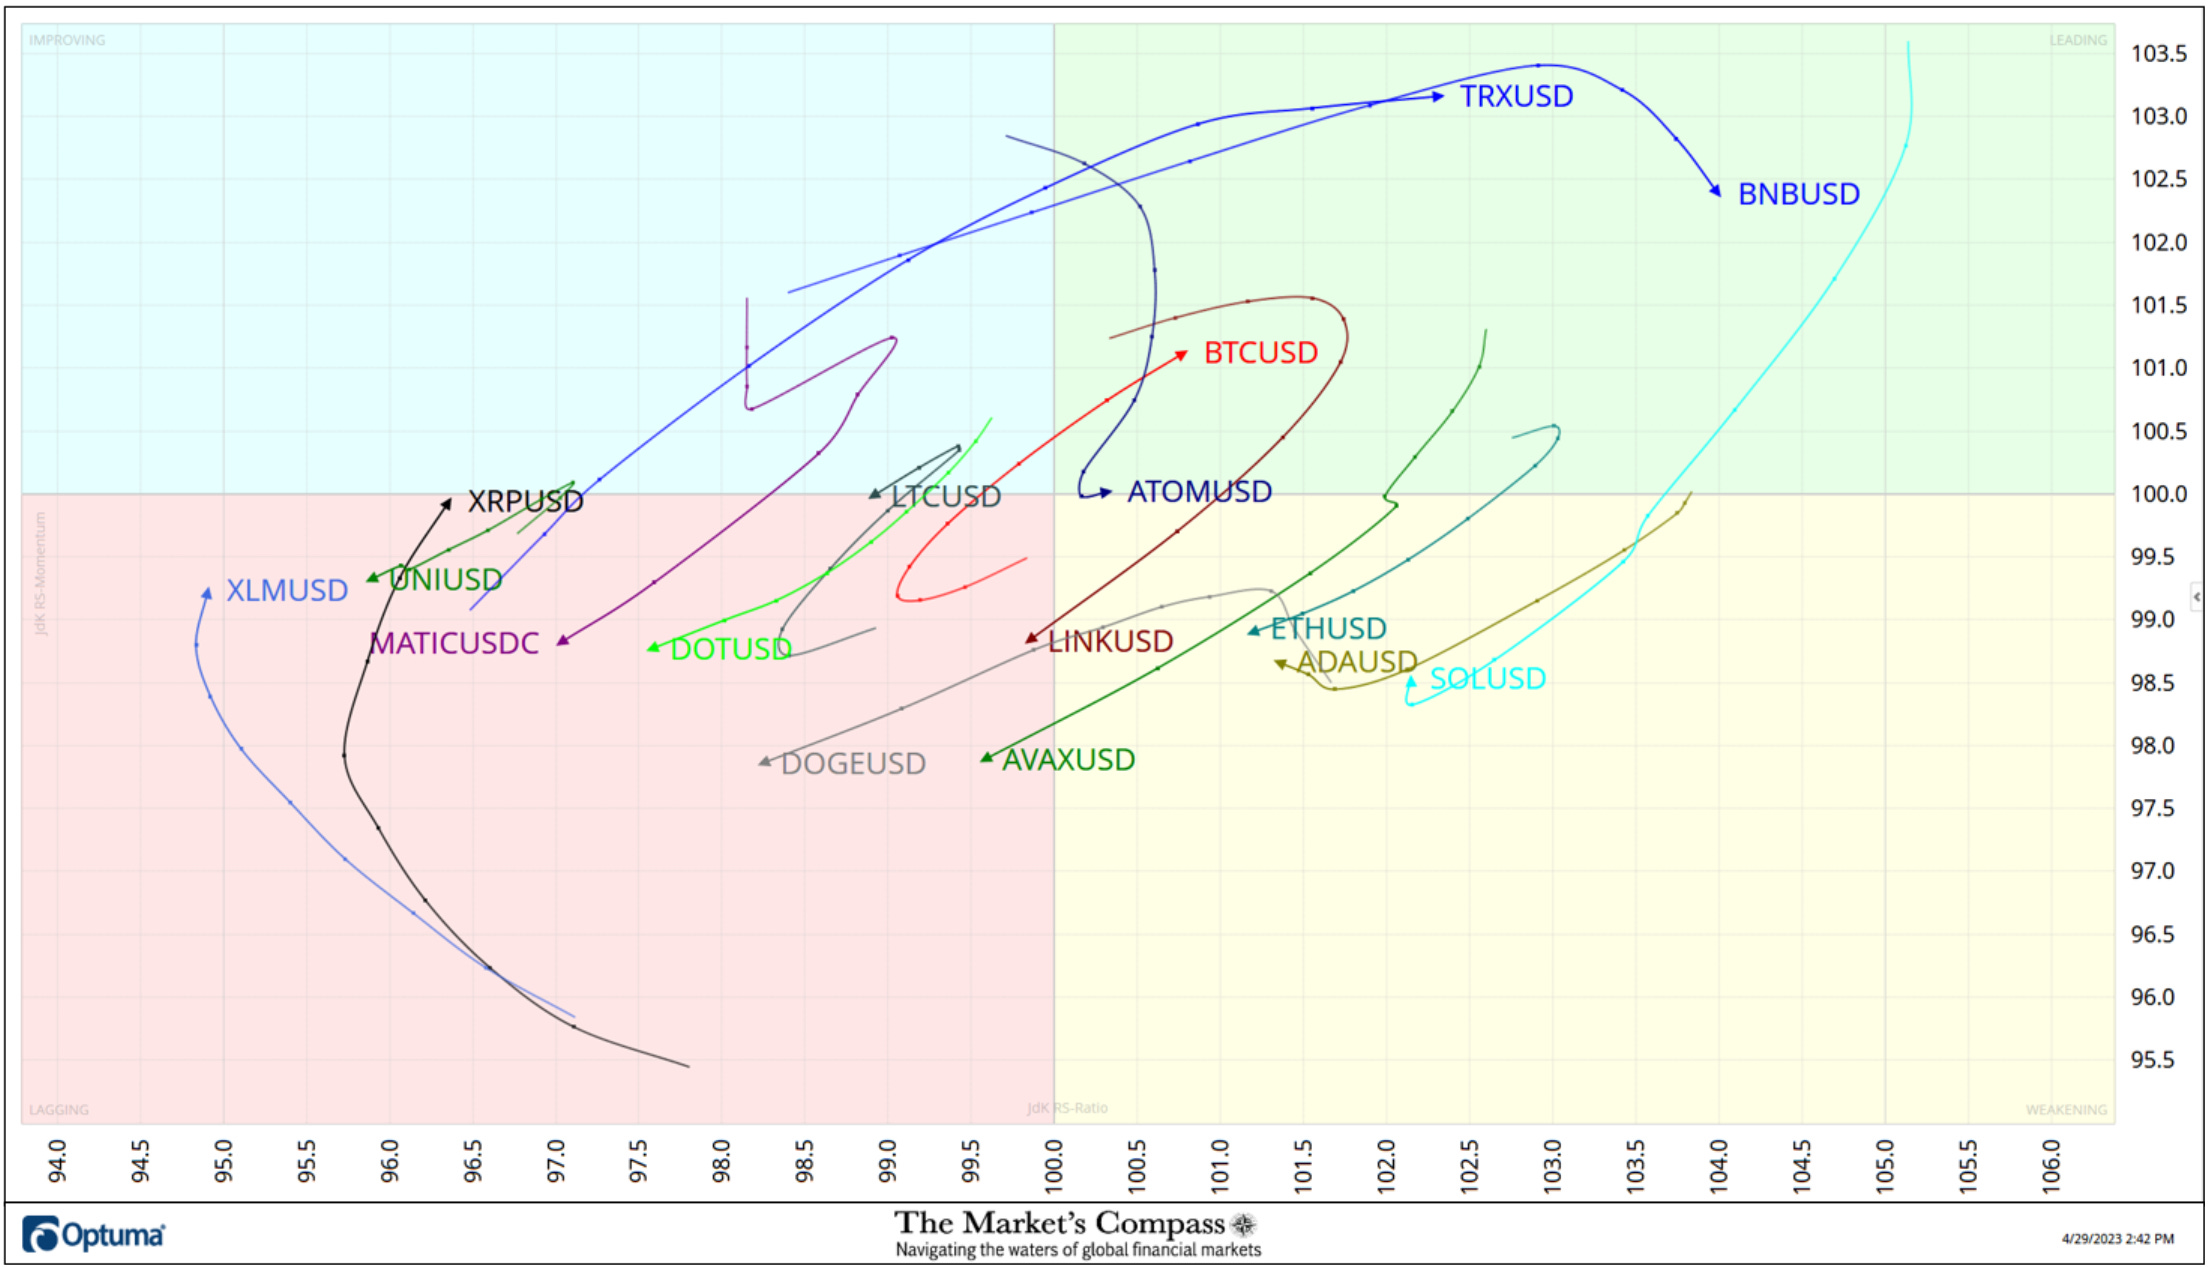
The seven-day RRG reflects the short-term acceleration in the improvement in relative strength in TRON (TRX) which has moved quickly from the Lagging Quadrant though the Improving Quadrant and into the Leading Quadrant. That acceleration can be seen as it quickly rose in the improving Quadrant by the distance between the dots in the tail as it came off a 12-month relative strength low. Although it remains in the Leading Quadrant Binance Coin (BNB) is beginning to to slow. Bitcoin’s aforementioned recent resurgent relative strength also is revealed in the RRG chart above.
Seven Day Absolute % Price Change*
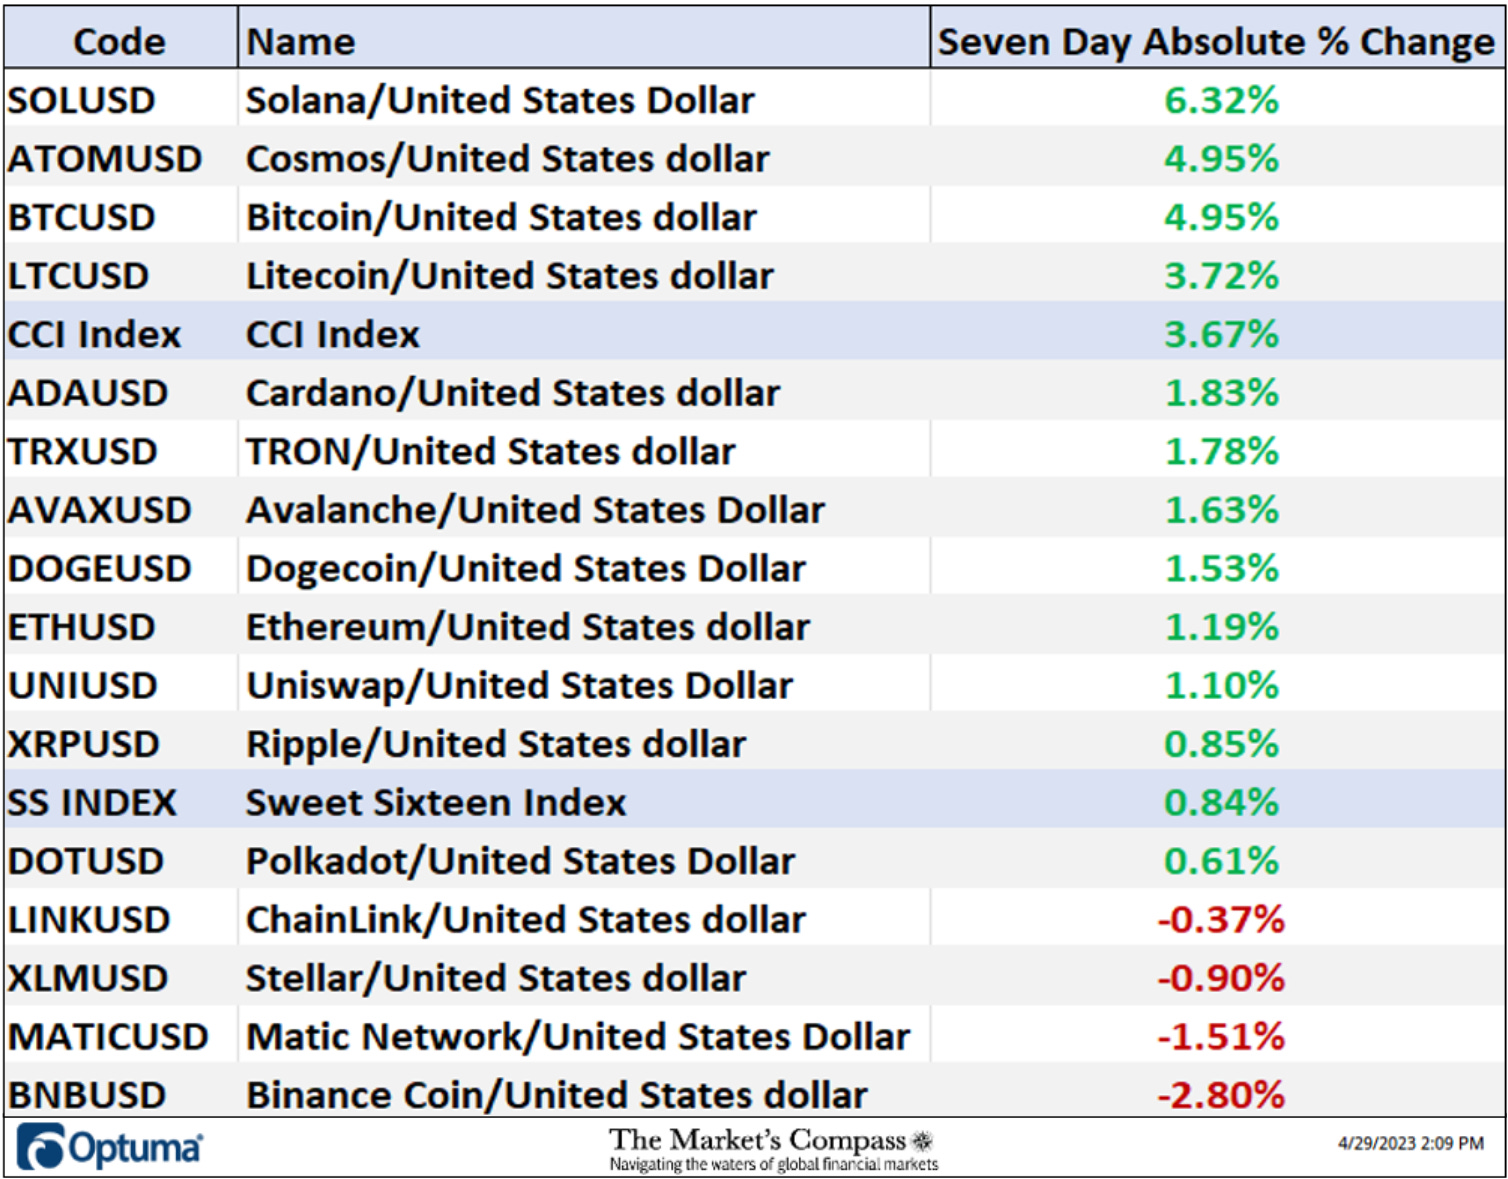
*Saturday to Saturday
The Technical Condition Factor changes since the week ending February 10th
There are eight Technical Condition Factors (“TCFs”) that determine individual TR scores (0-50). Each of these 8, ask objective technical questions (see the spreadsheet posted above). If a technical question is positive an additional point is added to the individual TR. Conversely if the technical question is negative, it receives a “0”. A few TCFs carry more weight than the others such as the Weekly Trend Factor and the Weekly Momentum Factor in compiling each individual TR of each of the 16 Cryptocurrencies. Because of that, the excel sheet above calculates each factor’s weekly reading as a percent of the possible total. For example, there are 7 considerations (or questions) in the Daily Momentum Technical Condition Factor (“DMTCF”) of the 16 Cryptocurrencies ETFs (or 7 X 16) for a possible range of 0-112 if all 16 had fulfilled the DMTCF criteria the reading would be 112 or 100%.
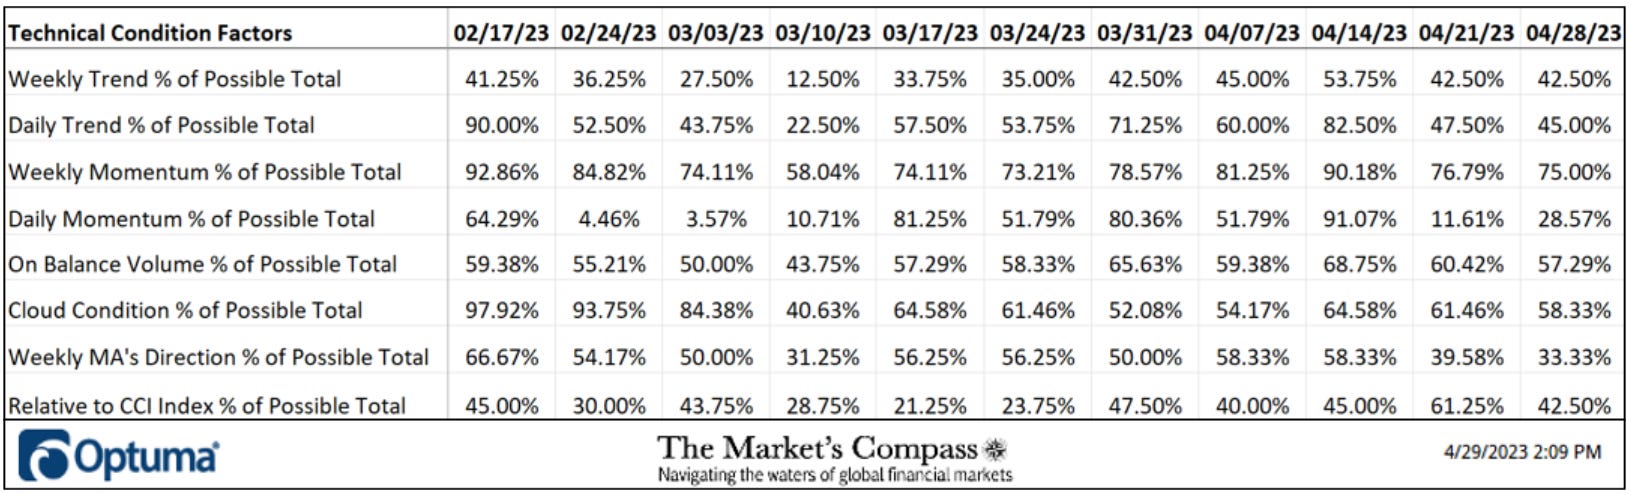
Two weeks ago, for the week ending April 21st, 13 of a possible total of 112 positive points or 11.61% reading in the DMTCF was registered marking an oversold reading of between 0% and 15% suggesting that there would be at the very least a short term bounce. As will be seen below that is what unfolded.
As a confirmation tool, if all eight TCFs improve on a week over week basis, more of the 16 Cryptocurrencies are improving internally on a technical basis, confirming a broader market move higher (think of an advance/decline calculation). Conversely, if more of the TCFs fall on a week over week basis, more of the “Cryptos” are deteriorating on a technical basis confirming the broader market move lower. Last week 6 TCFs fell, one moved higher (the Daily Momentum Factor out of oversold territory) and one was unchanged (the Weekly Trend Factor).
The CCi30 Index with This Week’s Sweet Sixteen Total Technical Ranking “SSTTR” Overlaid
The Sweet Sixteen Total Technical Ranking (“SSTTR”) Indicator is a total of all 16 Cryptocurrency rankings and can be looked at as a confirmation/divergence indicator as well as an overbought / oversold indicator. As a confirmation/divergence tool: If the broader market as measured by the CCi30 Index continues to rally without a commensurate move or higher move in the SSTTR the continued rally in the CCi30 Index becomes increasingly in jeopardy. Conversely, if the CCi30 Index continues to print lower lows and there is little change or a building improvement in the SSTTR a positive divergence is registered. This is, in a fashion, is like a traditional A/D Line. As an overbought/oversold indicator: The closer the SSTTR gets to the 800 level (all 16 Cryptocurrencies having a TR of 50) “things can’t get much better technically” and a growing number individual Crypto’s have become “stretched” there is more of a chance of a pullback in the CCi30. On the flip side the closer to an extreme low “things can’t get much worse technically” and a growing number of Crypto’s are “washed out technically” and an oversold rally or measurable low is closer to being in place. The 13-week moving average in Red smooths the volatile SSTTR readings and analytically is a better indicator of trend.
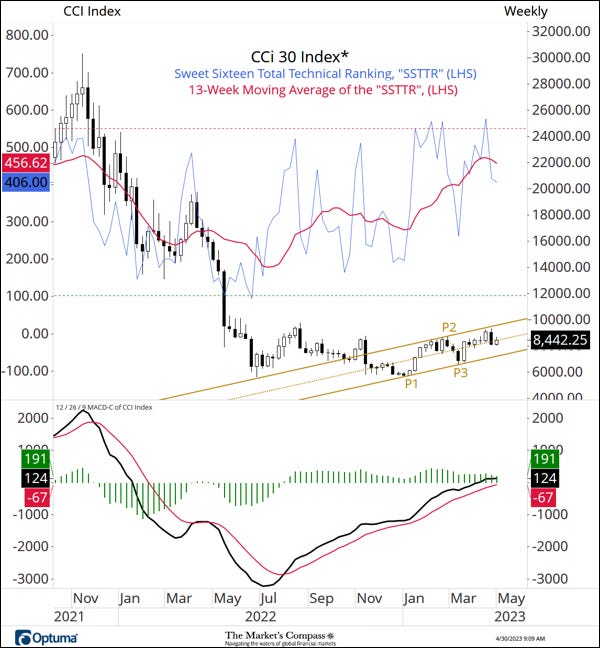
The SSTTR had entered overbought territory in concert with price approaching potential resistance at the Upper Parallel (solid gold line) of the Schiff Modified Pitchfork (gold P1 through P3) three weeks ago. I chose that Pitchfork variation because price respected the Upper Parallel (then support) in June of last year. Last week the CCi30 Index bounced back to the Median Line (gold dotted line) after breaking below it the previous week. The 13-Week Moving Average (red line) has continued to roll over but it also did so in March before the next leg higher. I now mark key support at first the Lower Parallel of the Schiff Modified Pitchfork (currently 7330) and next at the P3 swing low. Remembering that my technical thesis is that this a base building process, I still believe that the CCi30 Index will easily challenge price resistance at last June/July highs at the 10,000 /11,000 level in the weeks ahead.
The Market’s Compass Crypto Sweet Sixteen Index
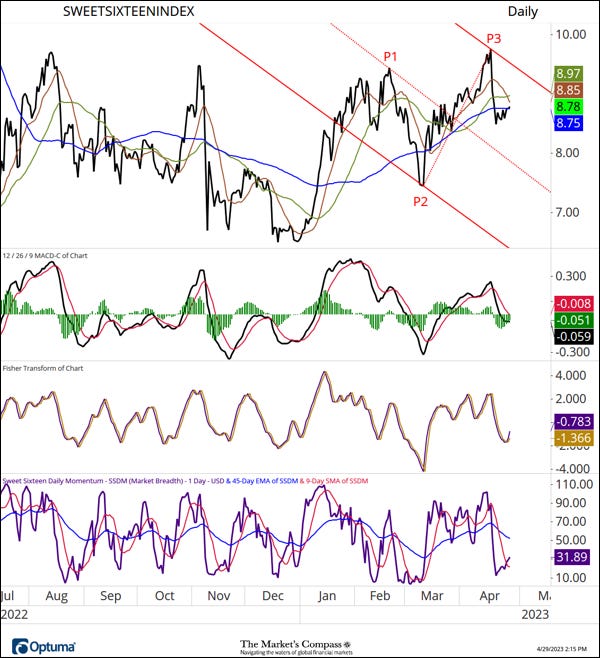
My Sweet Sixteen Daily Momentum / Breadth Oscillator reached an oversold condition a week ago and the Index bounced before testing support at the Median Line (red dotted line) of the Standard Pitchfork (red P1 through P3) in concert with a turn in the Fisher Transform and the beginning of a hook higher in MACD last week.
Charts are courtesy of Optuma whose charting software enables anyone to visualize any data including RRG Charts and our Objective Technical Rankings. Cryptocurrency price data is courtesy of Cryptowatch.
The following links are an introduction and an in depth tutorial on RRG Charts…
https://www.optuma.com/videos/introduction-to-rrg/
https://www.optuma.com/videos/optuma-webinar-2-rrgs/
To receive a 30-day trial of Optuma charting software go to…
A three part tutorial series on Andrews Pitchfork may be read at my web site…. www.themarketscompass.com
