
Welcome to The Market’s Compass US Index and Sector ETF Study, Week #466. As always it highlights the technical changes of the 30 US Index and Sector ETFs that I track on a weekly basis and normally publish every third week. Paid subscribers will receive this week’s unabridged Market’s Compass US Index and Sector ETF Study sent to their registered e-mail. Free subscribers on occasion will receive an excerpt of the full version. Past publications can be accessed by paid subscribers via The Market’s Compass Substack Blog.
In the spirit of Christmas, this week’s Blog will be sent to both free and paid subscribers. I will not be publishing the ETF Studies or Crypto Sweet Sixteen Studies for the next two weeks as I enjoy the Christmas Holiday and New Years celebration with family and friends. The next Market’s Compass ETF Study will be posted on Monday January 8th.
The Excel spreadsheet below indicates the weekly change in the objective Technical Ranking (“TR”) of each individual ETF. The technical ranking or scoring system is an entirely quantitative approach that utilizes multiple technical considerations that include but are not limited to trend, momentum, measurements of accumulation/distribution and relative strength. If an individual ETFs technical condition improves the Technical Ranking TR rises and conversely if the technical condition continues to deteriorate the TR falls. The TR of each individual ETF ranges from 0 to 50. The primary take away from this spread sheet should be the trend of the individual TRs, either the continued improvement or deterioration, as well as a change in direction. Secondarily, a very low ranking can signal an oversold condition and conversely a continued very high number can be viewed as an overbought condition, but with due warning, oversold conditions can continue at apace and overbought securities that have exhibited extraordinary momentum can easily become more overbought. In addition, if an individual TR “can’t “get out of its own way” while the broader market continues to rally it speaks volumes about poor relative strength. A sustained trend change needs to unfold in the TR for it to be actionable.
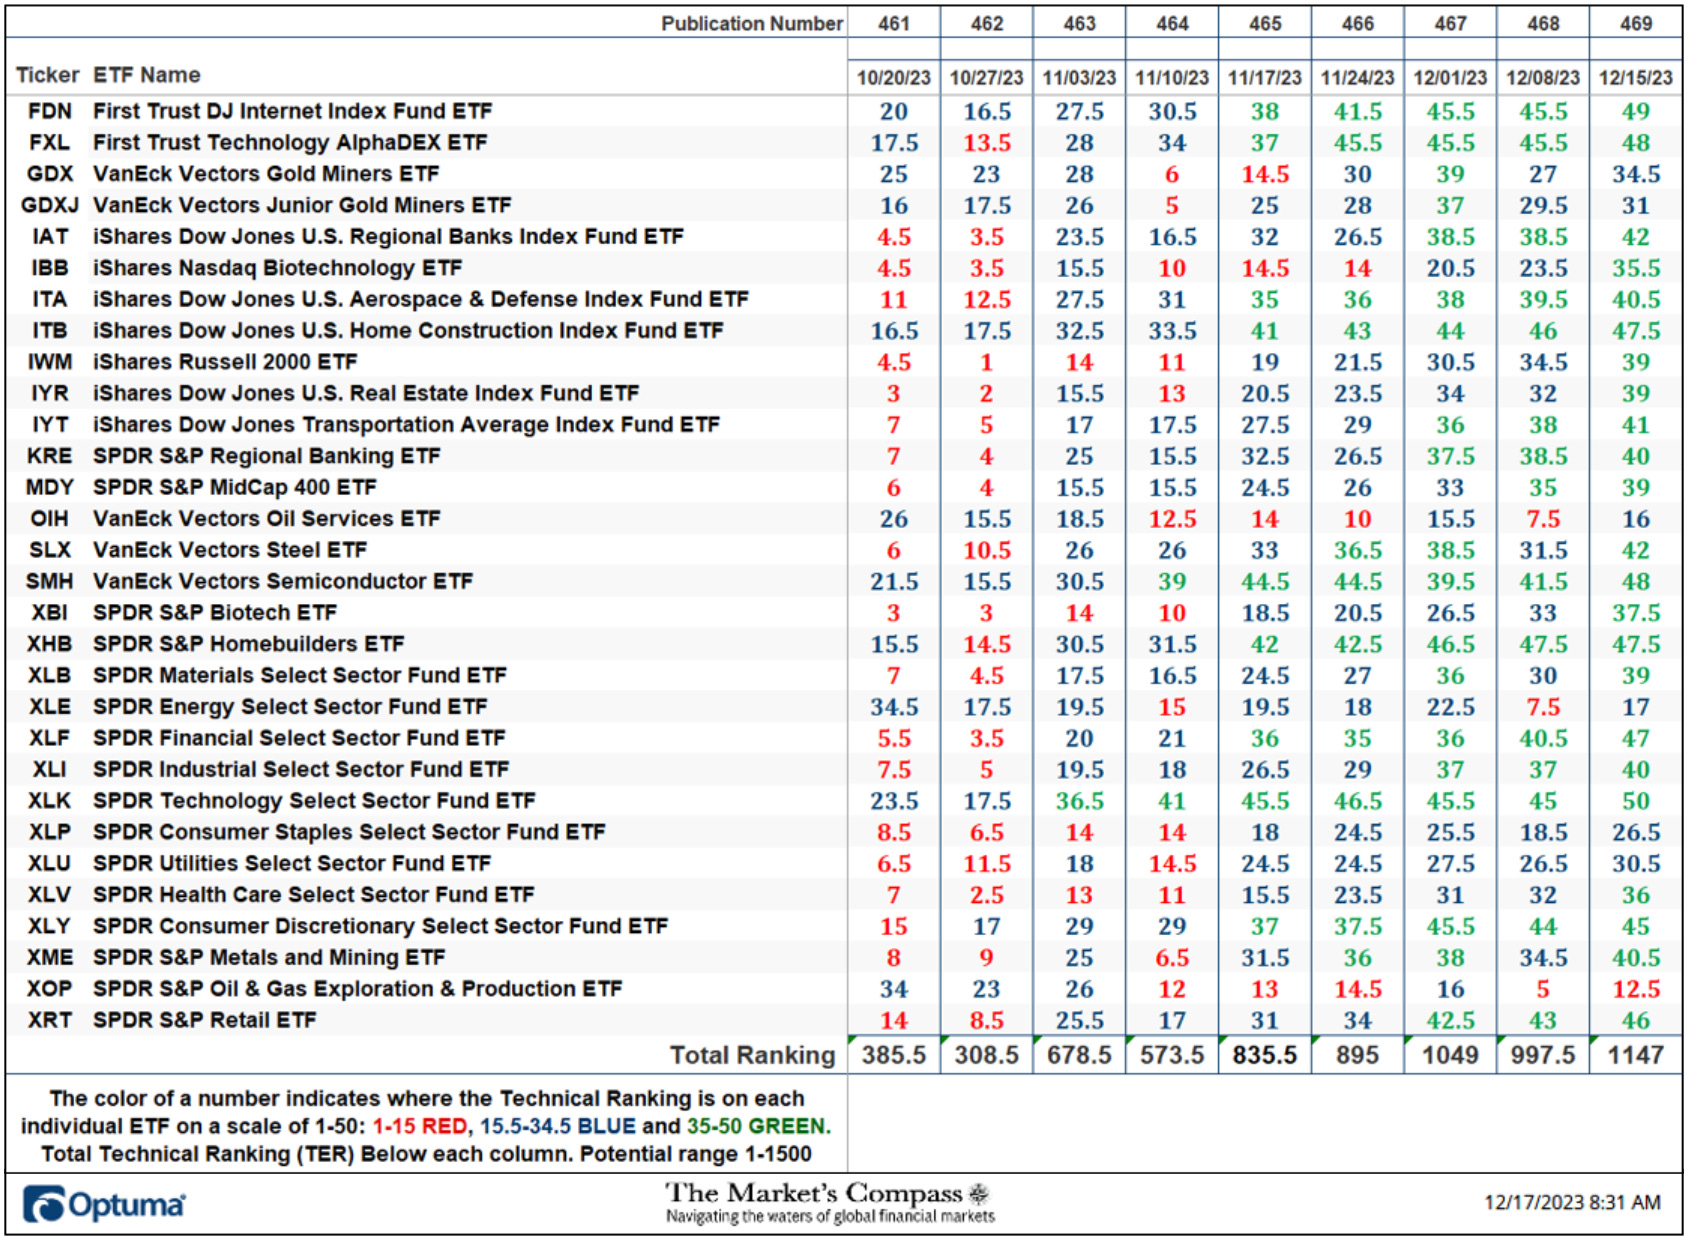
For the week ending December 8th (the week before last) there were fifteen ETFs in the “green zone” (TRs between 35-50), twelve ETFs were in the “blue zone” (TRs from 15.5 -34.5) and three were in the “red zone” (TRs from 1-15). At the end of last week twenty-three ETF were in the “green zone”, six ETFs in the “blue zone” and only one remained in the “red zone”. That was the SPDR S&P Oil & Gas Exploration and Production ETF (XOP). The Total ETF Ranking or “TER”, rose by +14.99% to 1147 from 997.5.
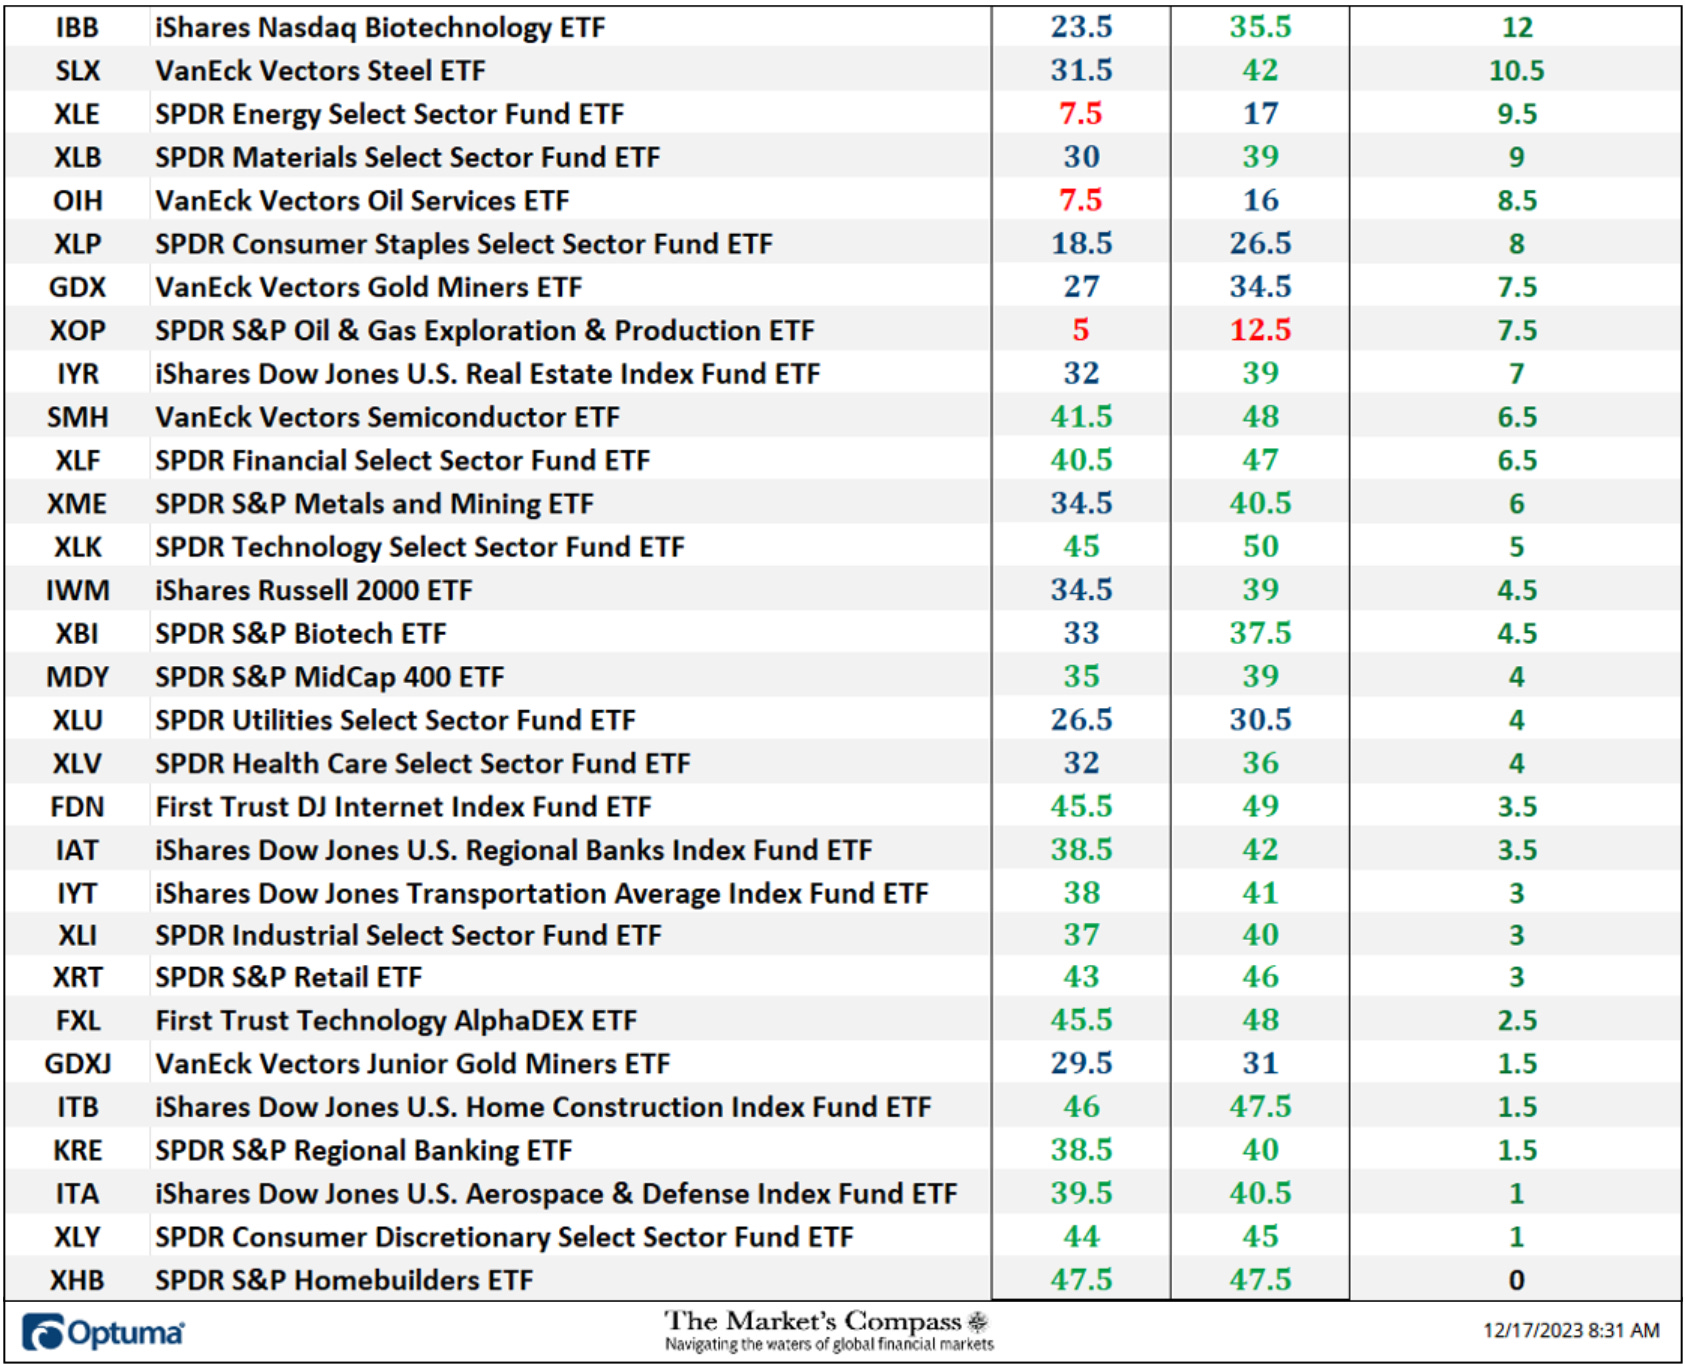
On a week over week basis 29 ETFs saw gains in their TRs and one had a TR that was unchanged. The average TR gain on the week was +4.98. The top three TR gainers were the iShares Nasdaq Biotechnology ETF (IBB) which rose +12 to 35.5 from 23.5 followed by the VanEck Vectors Steel ETF (SLX) which rose by + 10.5 “handles” to 42 from 31.5 and the SPDR Energy Select Sector Fund ETF (XLE) which rose +9.5 to 17 from 7.5. The SPDR Technology Select Sector Fund ETF (XLK) ended the week with not only the best Technical Ranking of the 30 ETFs we track in this Study but also recorded a perfect TR of 50.
There are eight Technical Condition Factors (“TCFs”) that determine individual TR scores (0-50). Each of these 8, ask objective technical questions (see the spreadsheet posted below). If a technical question is positive an additional point is added to the individual TR. Conversely if the technical question is negative, it receives a “0”. A few TCFs carry more weight than the others such as the Weekly Trend Factor and the Weekly Momentum Factor in compiling each individual TR of each of the 30 ETFs. Because of that, the excel sheet below calculates each Factor’s weekly reading as a percent of the possible total. For example, there are 7 considerations (or questions) in the Daily Momentum Condition Factor (“DMC”) of the 30 ETFs (or 7 X 30) for a possible range of 0-210 if all 30 ETFs had fulfilled the DMC Factor criteria the reading would be 210 or 100%.
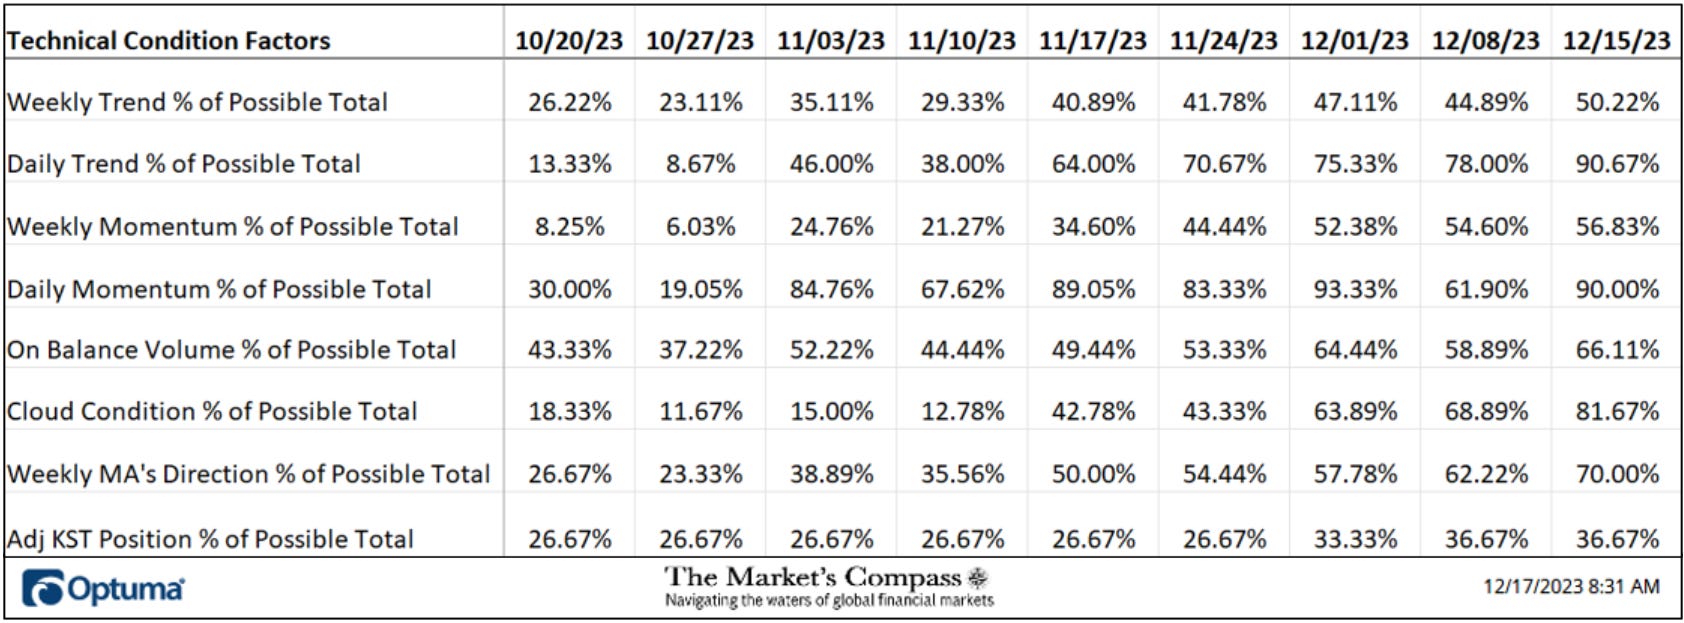
One technical take away would be if the DMC rises to an extreme between 85% and 100% it would suggest a short-term overbought condition. Conversely a reading in the range of 0% to 15% would suggest an oversold condition was developing. This past week a 90.00% overbought reading of the DMC Factor was registered, or 189 of a possible total of 210 positive points.
As a confirmation tool, if all eight TCFs improve on a week over week basis, more of the 30 ETFs are improving internally on a technical basis confirming a broader market move higher (think of an advance/decline calculation). Conversely if all eight TCFs fell over the week it confirms a move lower in the broader market. Last week seven TCFs moved higher and one was unchanged vs. the previous week confirming the broader market move higher.
The “TER” Indicator is a total of all 30 individual ETF rankings and can be looked at as an additional confirmation/divergence indicator as well as an overbought oversold indicator. As a confirmation/divergence tool: If the broader market as measured by the S&P 500 Index (SPX) continues to rally without a commensurate move or higher move in the “TER” the continued rally in the SPX Index becomes increasingly in jeopardy. Conversely, if the SPX Index continues to print lower lows and there is little change or a building improvement in the “TER” a positive divergence is registered. This is, in a fashion, like a traditional A/D Line. As an overbought/oversold indicator: The closer the “TER” gets to the 1500 level (all 30 ETFs having a “TR” of 50) “things can’t get much better technically” and a growing number individual ETFs have become “stretched” the more of a chance of a pullback in the SPX Index, On the flip side the closer to an extreme low “things can’t get much worse technically” and a growing number of ETFs are “washed out technically” an oversold rally or measurable low is close to being in place. The 13-week exponential moving average (red line) smooths the volatile “TR” readings and analytically is a better indicator of trend.
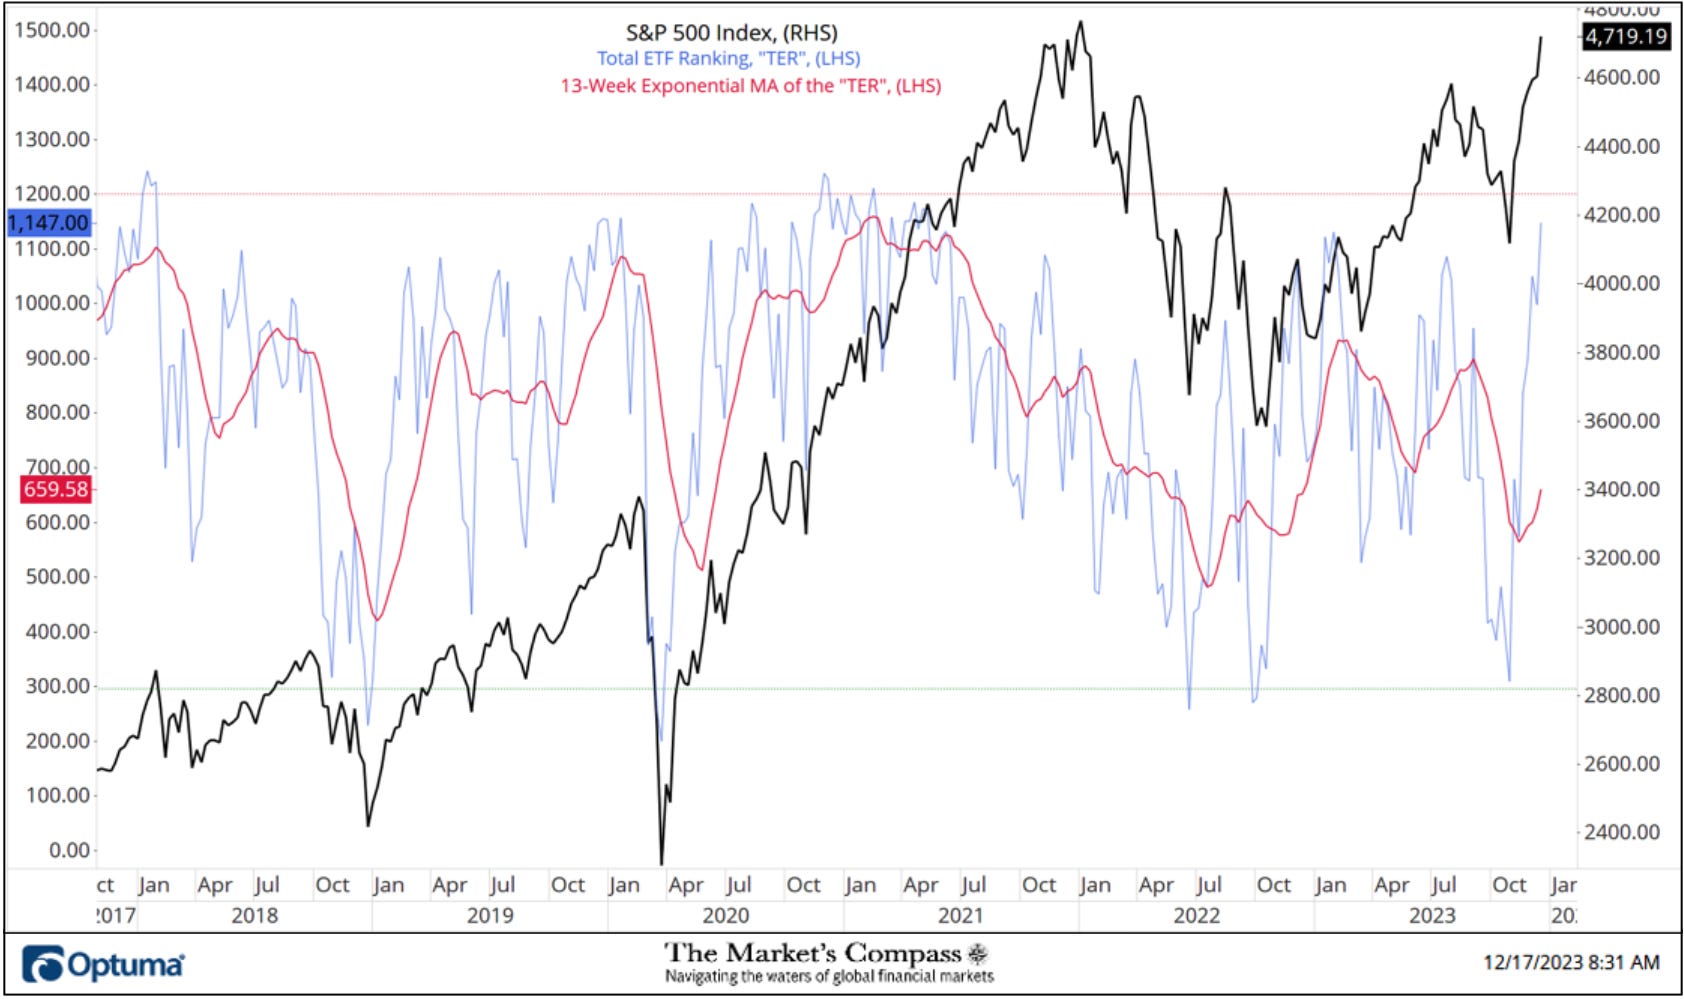
At the end of last week, the Total Technical Ranking, “TER”, rose to the highest level,1147, since April of 2021. In doing so the “TER” finally confirmed the new recovery closing price highs on Friday (4,719.19) although it can be considered a double-edged sword in that the “TER” is quickly closing in on overbought level. The 13-Week Exponential Moving Average which had hooked higher in November is tracking higher in concert with the “TER”. The rally from the late October price lows has been impulsive and I expect that before a meaningful pullback develops the SPX Index will challenge the December 31st, 2021, closing high at 4,766.16.
The Weekly Average Technical Ranking (“ATR”) is the average Technical Ranking of the 30 US Index and Sector ETFs we track. Like the TER, it is a confirmation/divergence or overbought/oversold indicator.

After two weeks of failed attempts (although it did make progress on the price front) the large cap index overtook the Upper Parallel (solid purple line) of the Standard Pitchfork (purple P1 though P3) by the end of last week. After it became clear that an important swing low was in place eight weeks ago I added a second Pitchfork. In this case it is a Schiff Pitchfork variation (green P1 through P3) the Upper Parallel of that Pitchfork (solid green line) has thus far capped the rally. The Average Technical Ranking Oscillator, “ATR” has reached an overbought level extreme at 38.23. It is not uncommon for the ATR to eclipse the 41/42 level but it is currently close to that extreme level. As I said previously, the impulsive nature of the rally along with the turn in MACD back through its signal line suggests to me that the December 2021 highs will be challenged but the momentum oscillator has yet to confirm the new price recovery highs.
More on the shorter term technical condition in “Thoughts on the short-term technical condition of the SPX Index” later in the Blog but first….
*Does not include dividends
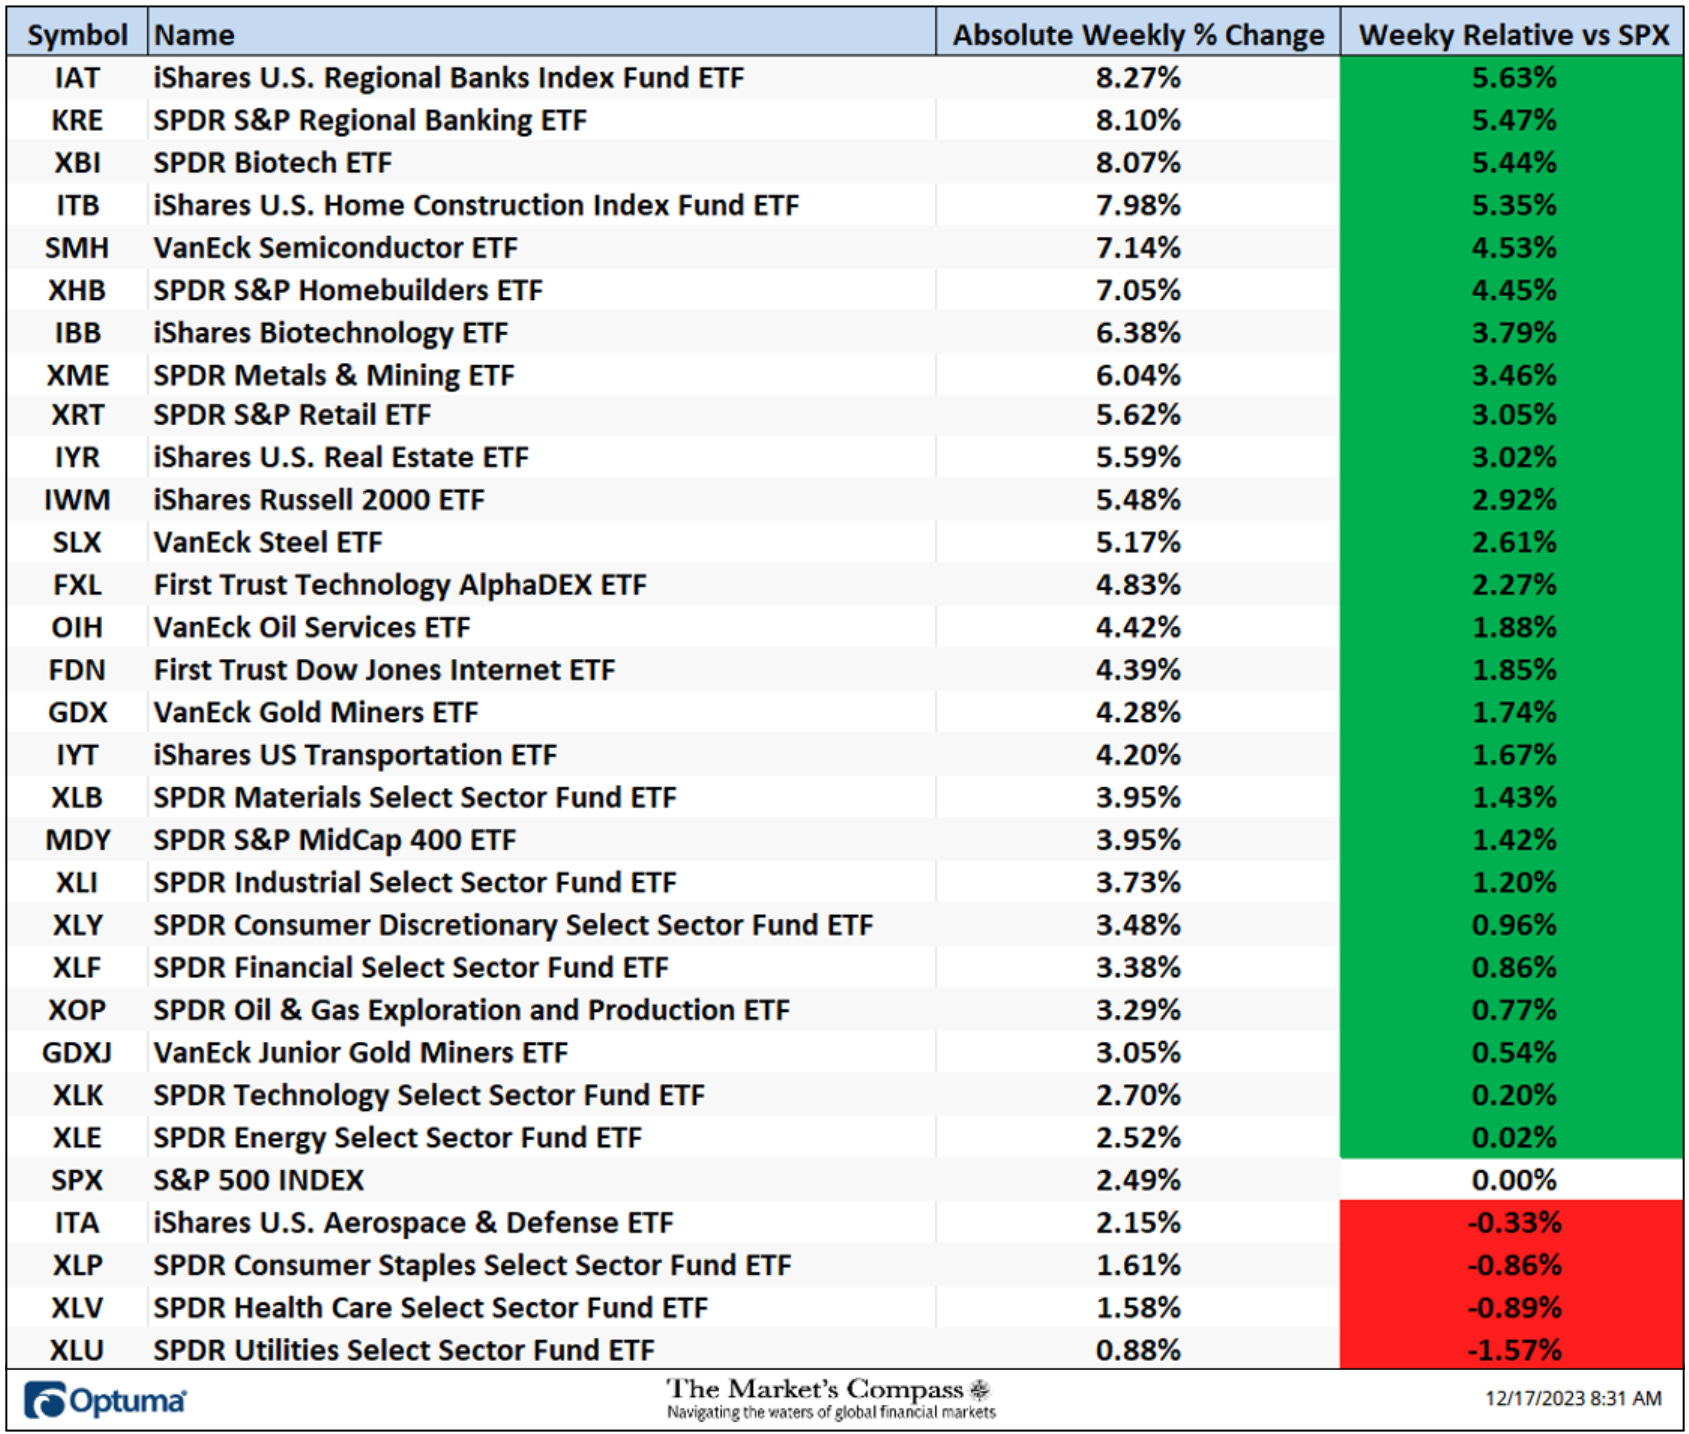
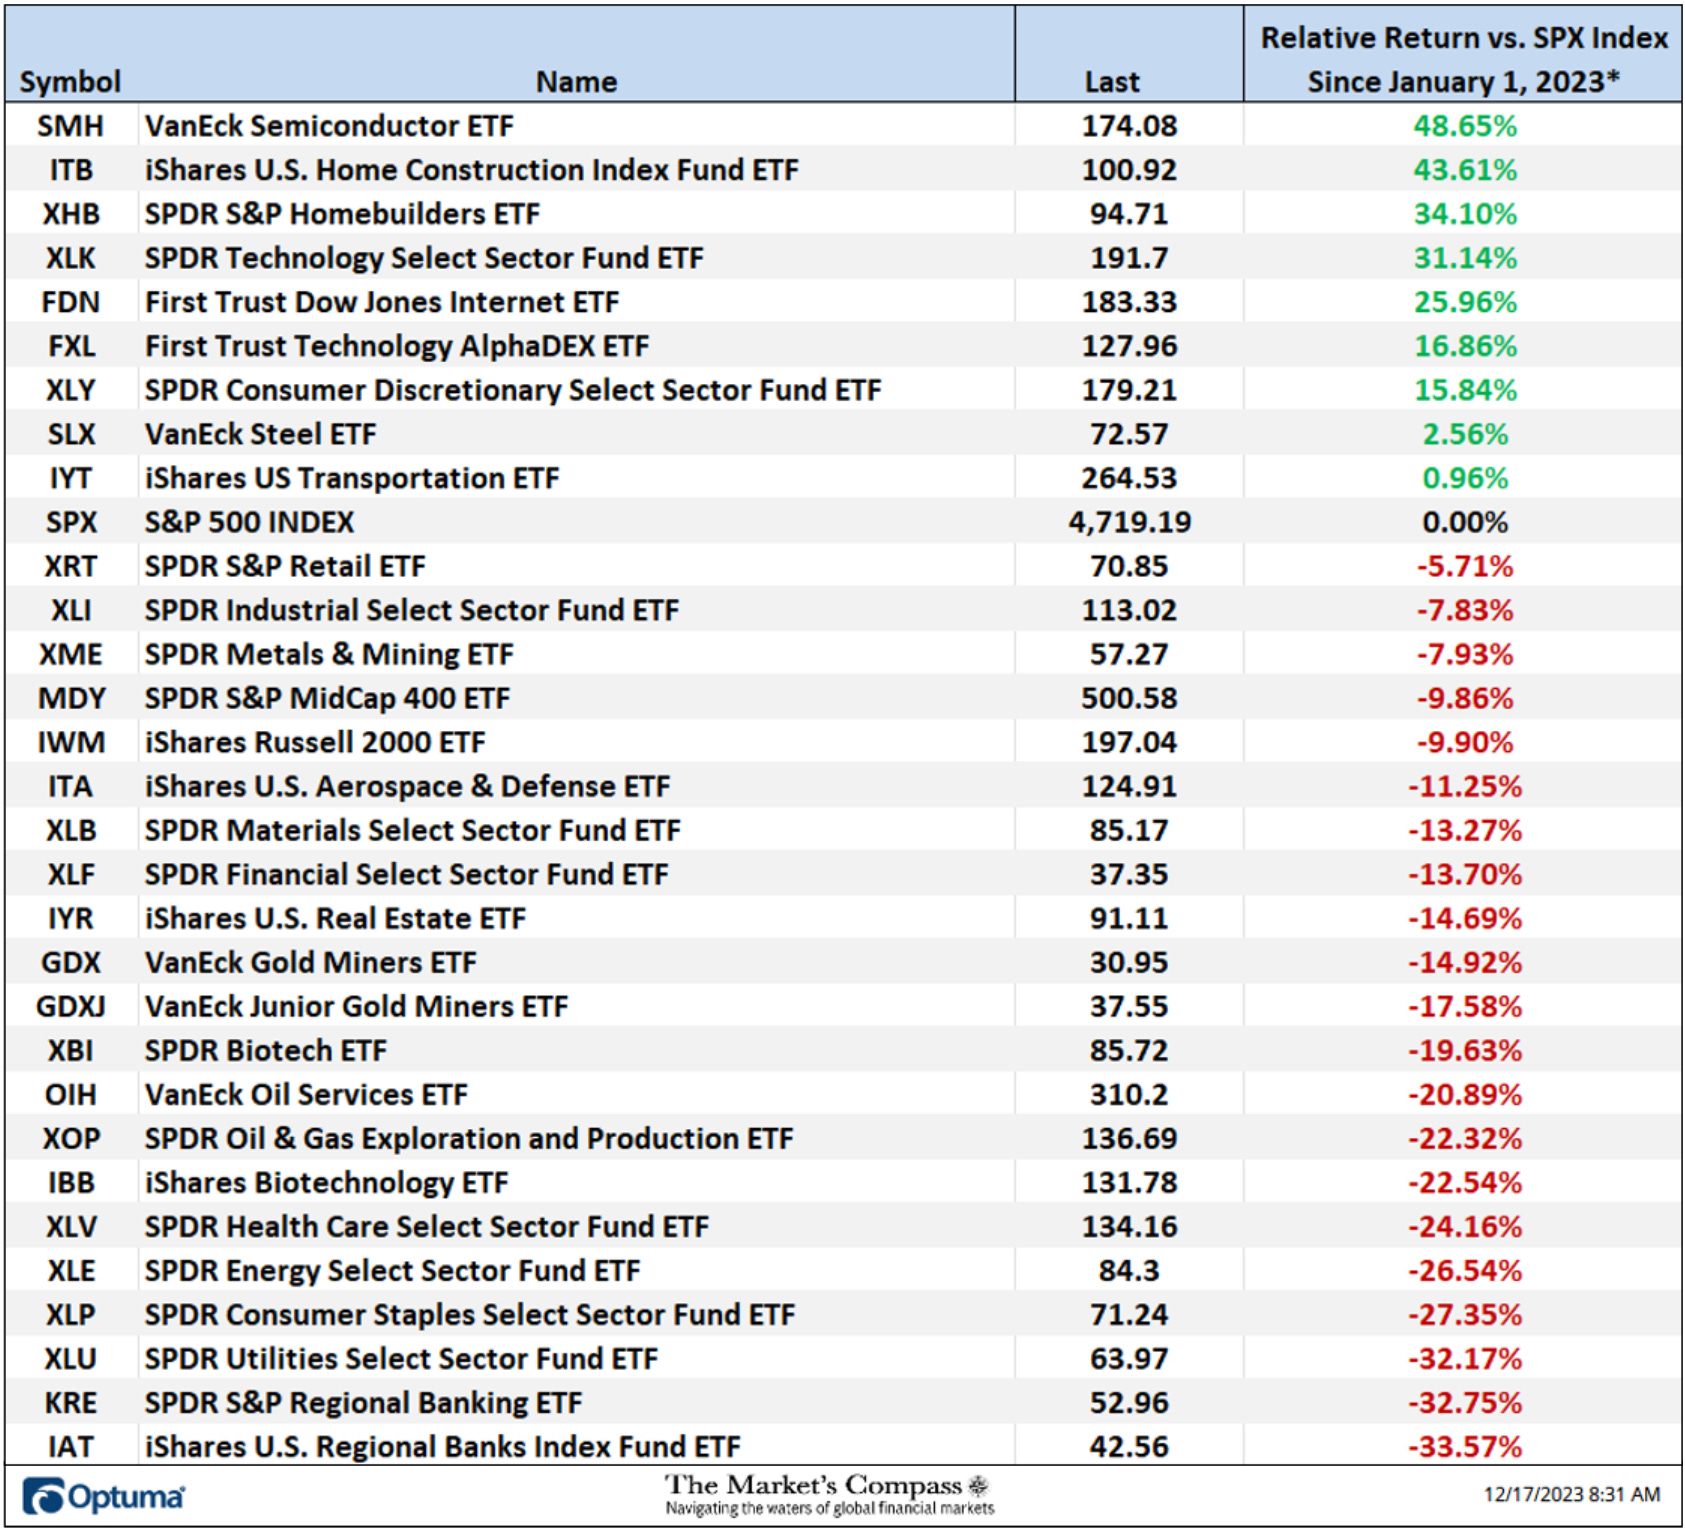
All 30 of the US ETFs we track in this blog advanced on an absolute basis last week. The average absolute gain on the week was +4.37% vs. a +2.49% gain in the SPX Index. That added to the previous week’s average absolute gain of +0.90%. Only four ETFs underperformed the large cap indexes weekly gain. The best two absolute gainers were the iShares U.S. Regional Banks Index Fund ETF (IAT) up +8.27% followed by a 8.10% gain in the SPDR S&P Regional Banking ETF (KRE). As will be seen later in the Blog, despite the better performance last week, it will take a lot more bottom fishing to recover all the lost ground over the year. Both bank ETFs are still at the bottom of the year-to-date performance list.
*Of interest to scalpers, traders, and technicians
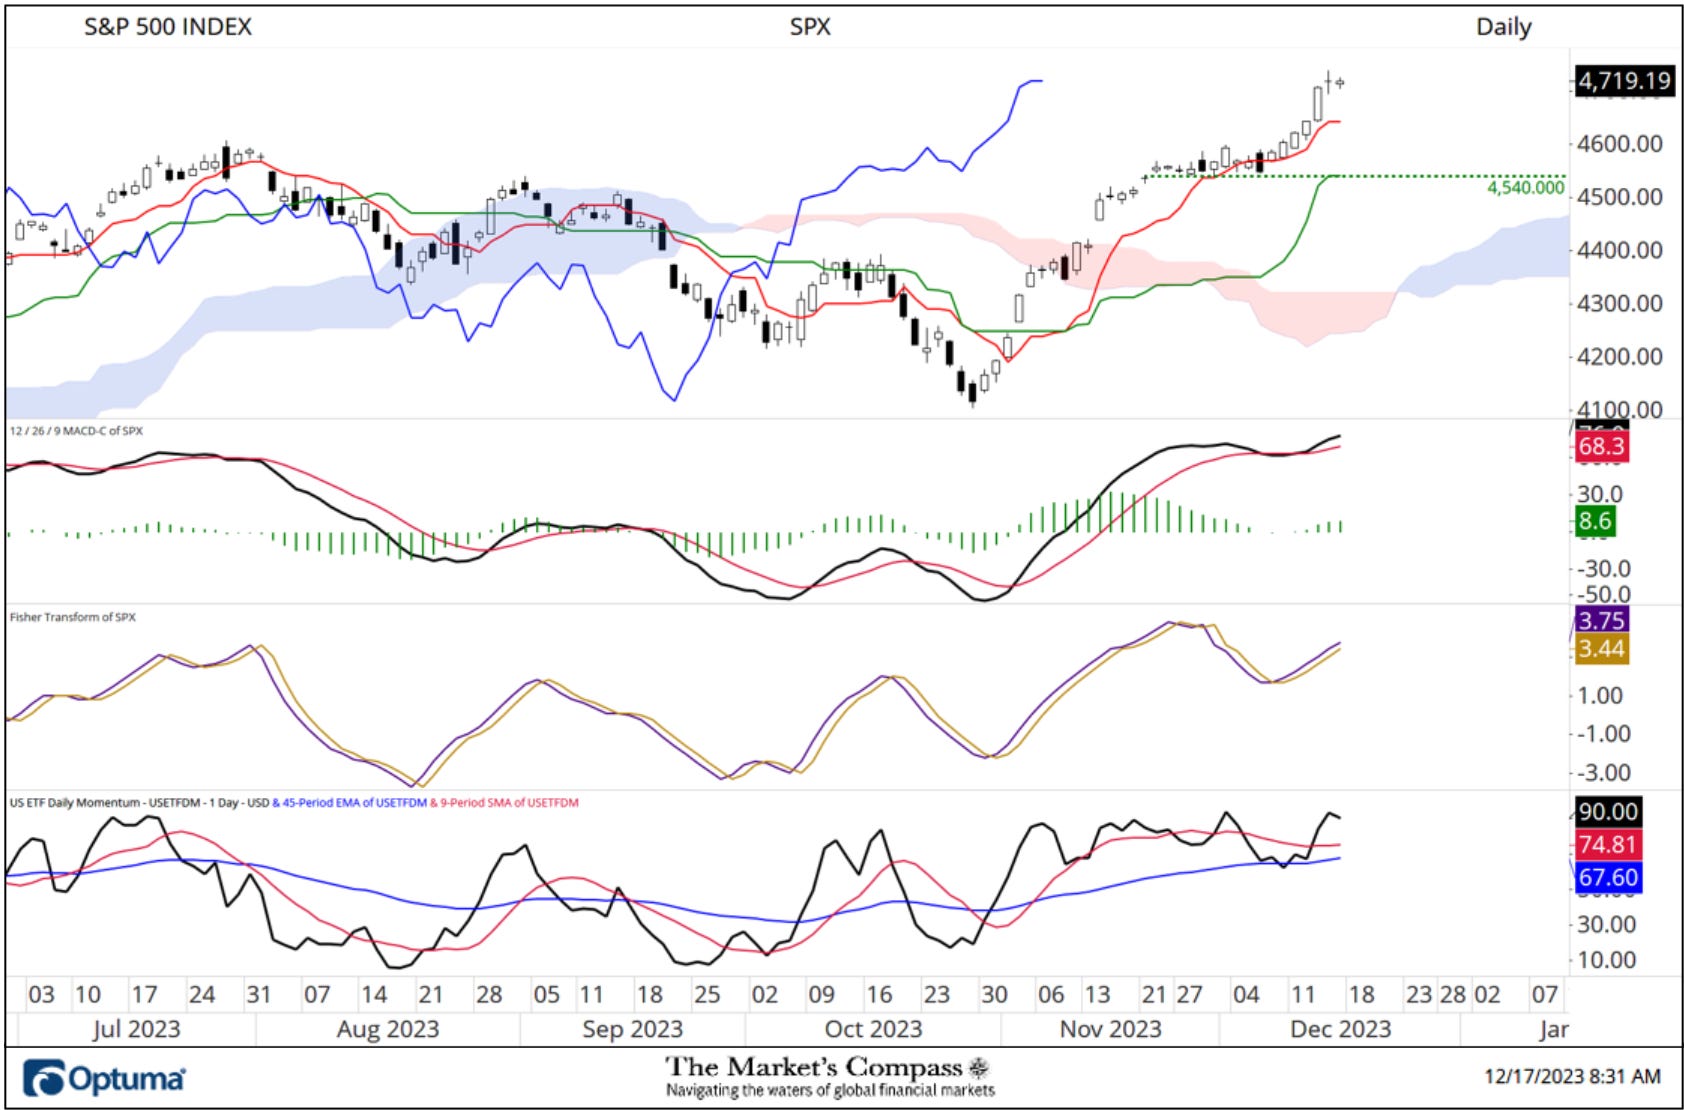
After two weeks of price consolidation the SPX lifted off again with MACD retaking the ground above its signal line in positive territory and with it the momentum oscillator has confirmed the new price highs. The early turning Fisher Transform is not giving a hint that the rally has run its course. One minor technical concern is that my US ETF Daily Momentum / Breadth Oscillator has yet to confirm the new price highs. Key price and Kijun Plot (solid green line) support is at 4,540.
*Does not include dividends
For readers who are unfamiliar with the technical terms or tools referred to in the comments on the technical condition of the SPX can avail themselves of a brief tutorial titled, Tools of Technical Analysis or the Three-Part Pitchfork Papers that is posted on The Markets Compass website…
https://themarketscompass.com
Charts are courtesy of Optuma.
To receive a 30-day trial of Optuma charting software go to…
