
Welcome to this week’s publication of the Market’s Compass Developed Markets Country (DMC) ETF Study #475. As always it highlights the technical changes of the 22 DM Country ETFs that I track on a weekly basis and publish every third week, There are three ETF Studies that include the Market’s Compass US Index and Sector (USIS) ETF Study, the Developed Markets Country (DMC) ETF Study and the Emerging Markets Country (EMC) ETF Study. The three Studies are normally published every three weeks and sent to paid subscriber’s email. There is now a Weekly publication that is sent to paid subscribers every Sunday titled The Market’s Compass Crypto Sweet Sixteen Study that tracks the technical condition of sixteen of the larger cap Cryptocurrencies that also uses (like the ETF Studies) an objective technical ranking model among other measures including relative strength and my preferred technical analysis tools.
The Excel spreadsheet below indicates the weekly change in the objective Technical Ranking (“TR”) of each individual ETF. The technical ranking or scoring system is an entirely quantitative approach that utilizes multiple technical considerations that include but are not limited to trend, momentum, measurements of accumulation/distribution and relative strength. If an individual ETFs technical condition improves the Technical Ranking (“TR”) rises and conversely if the technical condition continues to deteriorate the “TR” falls. The “TR” of each individual ETF ranges from 0 to 50. The primary take-away from this spread sheet should be the trend of the individual “TRs” either the continued improvement or deterioration, as well as a change in direction. Secondarily a very low ranking can signal an oversold condition and conversely a continued very high number can be viewed as an overbought condition but with due warning, over sold conditions can continue at apace and overbought securities that have exhibited extraordinary momentum can easily become more overbought. A sustained trend change needs to unfold in the individual TR for it to be actionable.
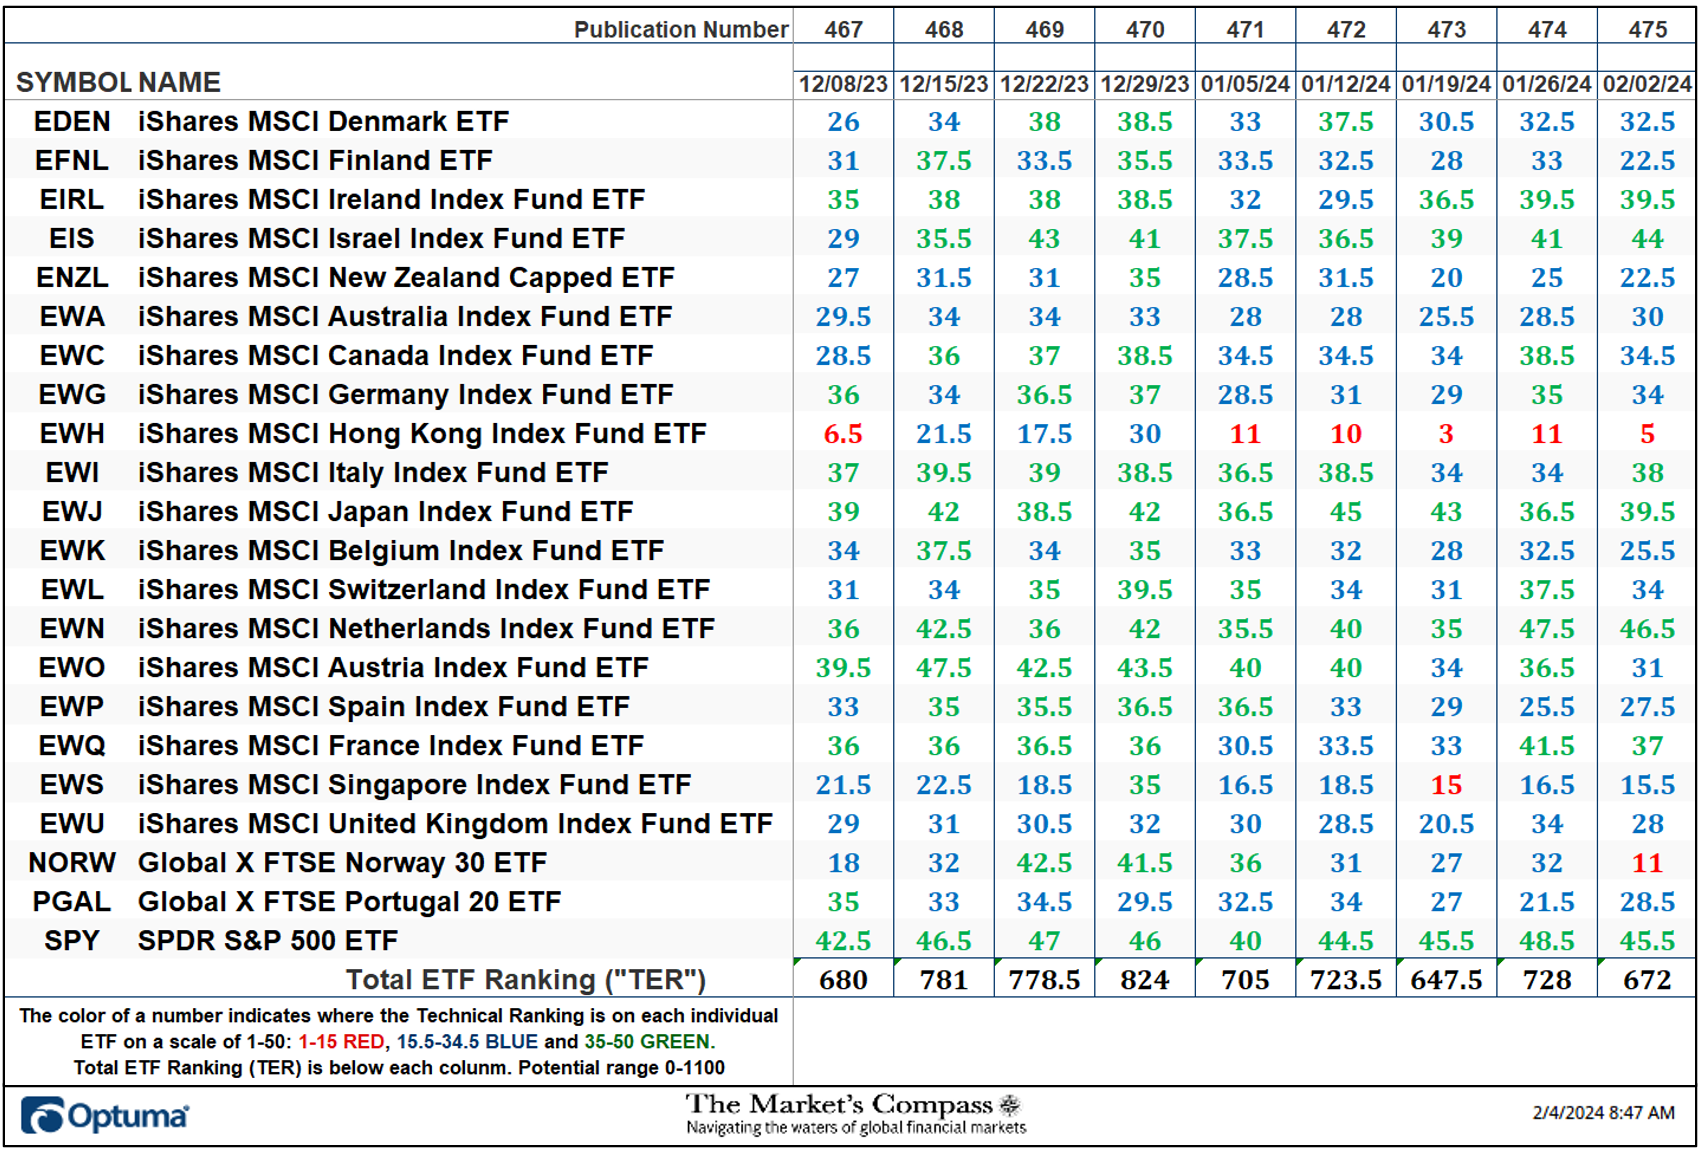
On a WoW basis the Total Developed Markets ETF Ranking (“TER”) fell -7.69% to 672 from 728 the previous week. Six weeks ago, the TER had risen to 824 for the week ending December 29th which was the highest TER reading since January of last year.
Six of the Developed Country Market TRs we track in these pages registered a gain in their TRs on a WoW basis, two were unchanged and fourteen fell. As can be seen above at the end of last week there were seven ETFs in the “green zone” (35 to 50), thirteen were in the “blue zone” (15.5 to 34.5) and two were in the “red zone” (0-15). This was versus the week before when there were ten TRs in the “green zone”, eleven TRs in the “blue zone” and one was in the “red zone” (0 to 15) which was the iShares MSCI Hong Kong Index Fund ETF (EWH). That was the fifth week in a row that the EWH was in the “red zone” (see chart below with technical comments). The Average TR loss of the 22 Developed Markets Country ETFs last week was -2.54 vs. an average gain of +3.75 the week before. The Global X FTSE Norway 30 ETF entered the “red zone” last week with the largest TR loss of the 22 with a sharp drop in TR to 11 from 32.
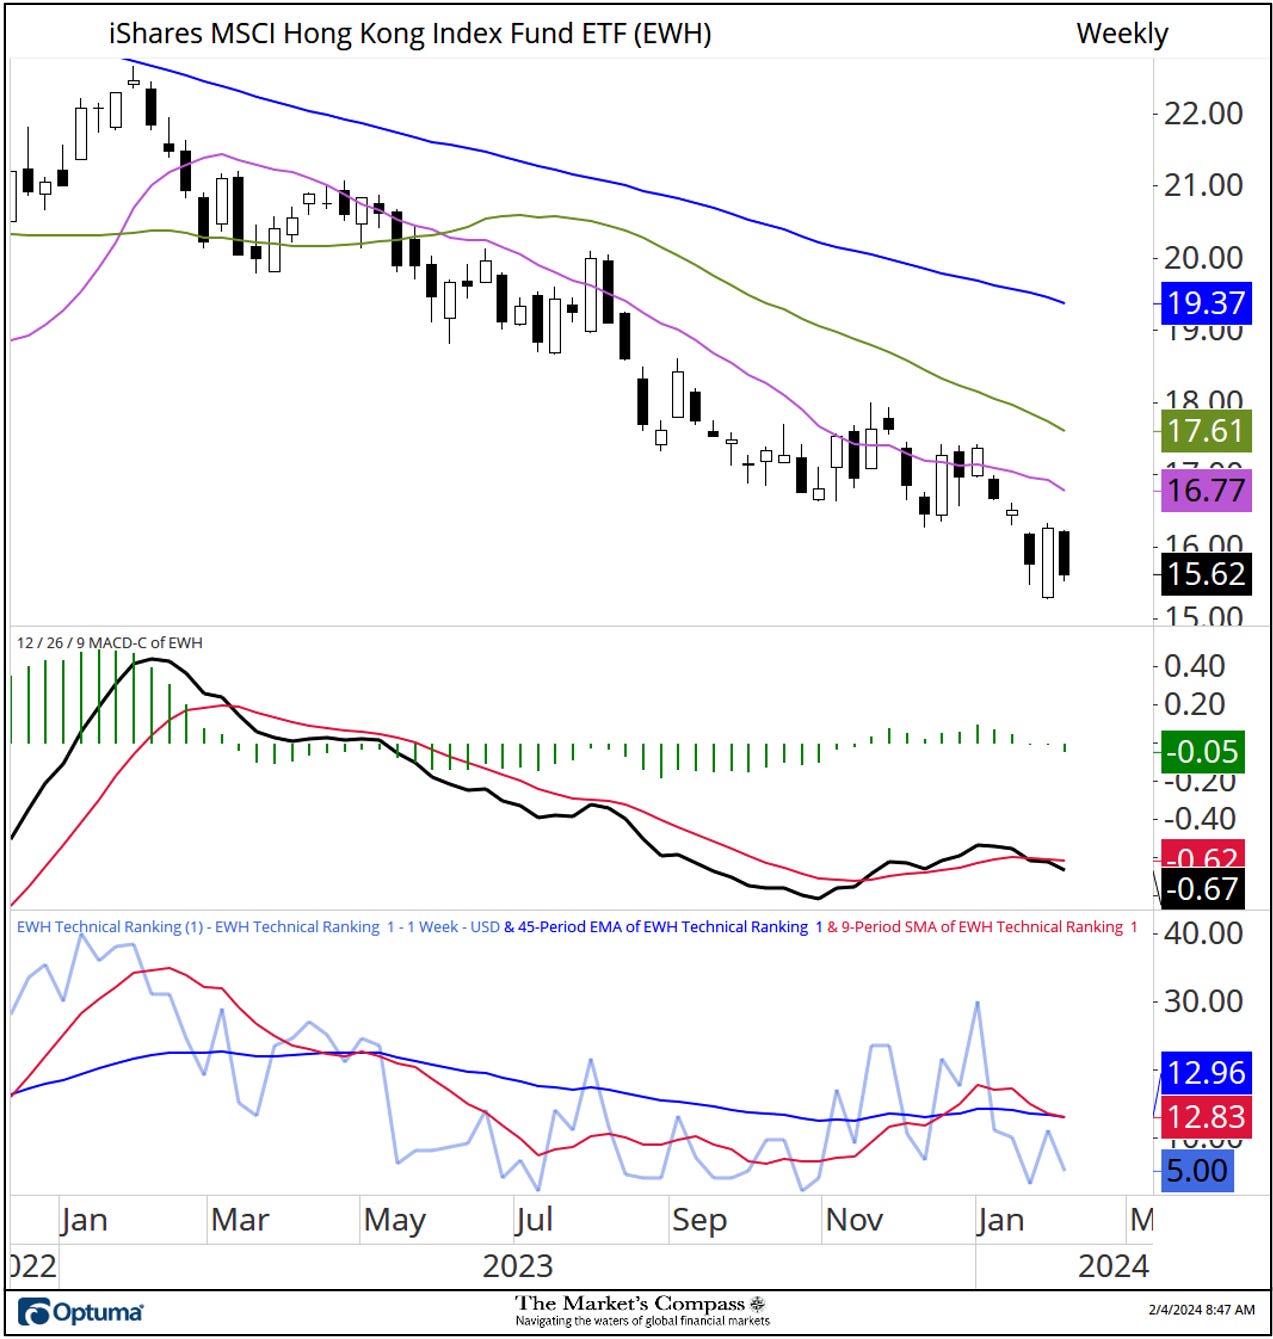
The iShares MSCI Hong Kong Index Fund ETF (EWH) has been in a steady downtrend since January of last year with all three moving averages tracking lower. Aside from a brief recovery late last year MACD reflects the downside price momentum as it istracking lower again below it signal line. Although there has been a large measure of volatility the Technical Ranking has been falling steadily, note the longer-term moving average (blue line) in lower panel. These technical features suggest it would folly to bottom fish at this time.

There are eight Technical Condition Factors (“TCFs”) that determine individual TR scores (0-50). Each of these 8, ask objective technical questions (see the spreadsheet posted above). If a technical question is positive an additional point is added to the individual TR. Conversely if the technical question is negative, it receives a “0”. A few TCFs carry more weight than the others such as the Weekly Trend Factor and the Weekly Momentum Factor in compiling each individual TR of each of the 22 ETFs. Because of that, the excel sheet above calculates each factor’s weekly reading as a percentage of the possible total. For example, there are 7 considerations (or questions) in the Daily Momentum Technical Condition Factor (“DMTCF”) of the 22 ETFs (or 7 X 22) for a possible range of 0-154 if all 22 ETFs had fulfilled the DMTCF criteria the reading would be 154 or 100%.
A 44.16% reading in the DMTCF was registered for the week ending February 2nd, or 68 out of 154 points. In doing so, rising from a nearly oversold reading of 16.23% or 25 two weeks before.
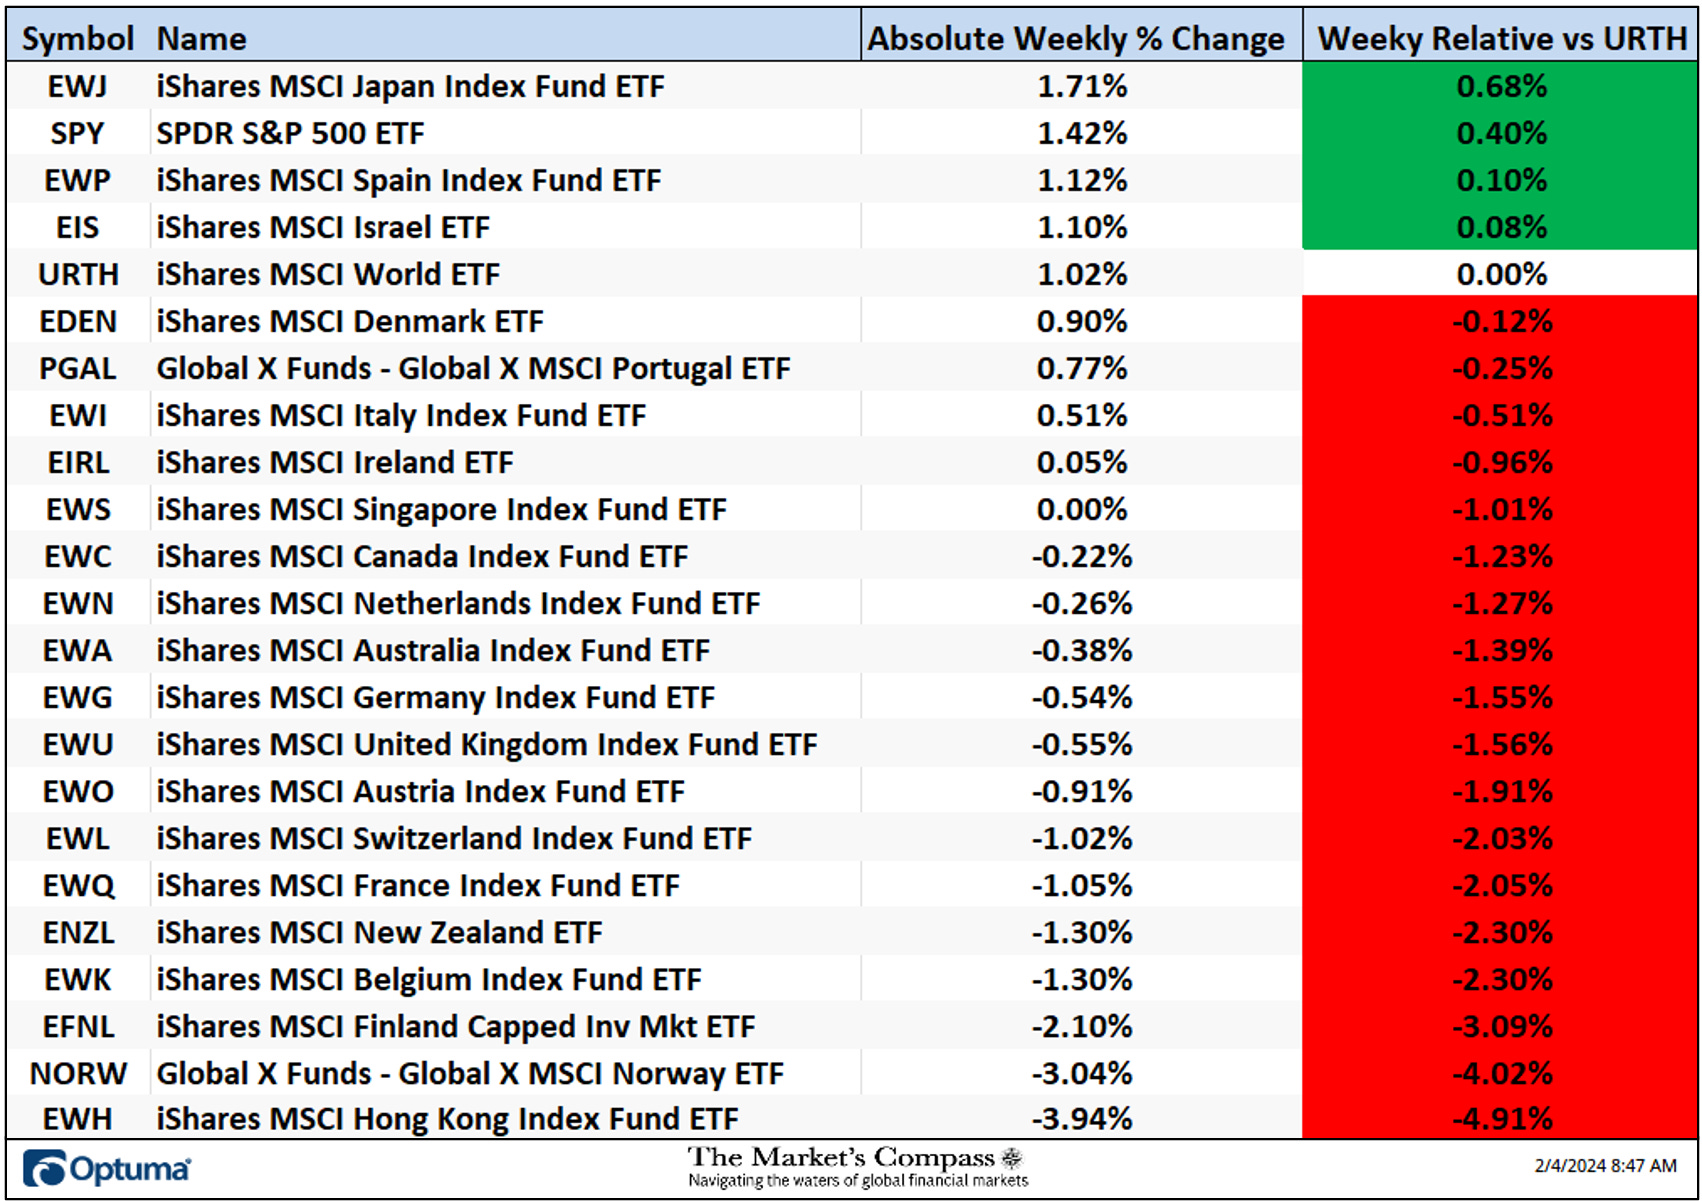
As a confirmation tool, if all eight TCFs improve on a week over week basis, more of the 22 ETFs are improving internally on a technical basis, confirming a broader market move higher (think of an advance/decline calculation). Conversely, if more of the 22 TCFs fall on a week over week basis, more of the ETFs are deteriorating on a technical basis confirming the broader market move lower. Last week all eight TCFs lost ground producing a non-confirmation of last week’s +1.02% gain in the iShares MSCI World ETF (URTH).
The Total Technical ETF Ranking (“TER”) Indicator is a total of all 22 ETF rankings and can be looked at as a confirmation/divergence indicator as well as an overbought oversold indicator. As a confirmation/divergence tool: If the broader market as measured by the iShares MSCI World Index ETF (URTH) continues to rally without a commensurate move or higher move in the TER the continued rally in the URTH becomes increasingly in jeopardy. Conversely, if the URTH continues to print lower lows and there is little change or a building improvement in the TER a positive divergence is registered. This is, in a fashion, is like a traditional A/D Line. As an overbought/oversold indicator: The closer the TER gets to the 1100 level (all 22 ETFs having a TR of 50) “things can’t get much better technically” and a growing number individual ETFs have become “stretched” the more of a chance of a pullback in the URTH. On the flip side the closer to an extreme low “things can’t get much worse technically” and a growing number of ETFs are “washed out technically” an oversold rally or measurable low is close to be in place. The 13-week exponential moving average in Red smooths the volatile TER readings and analytically is a better indicator of trend.
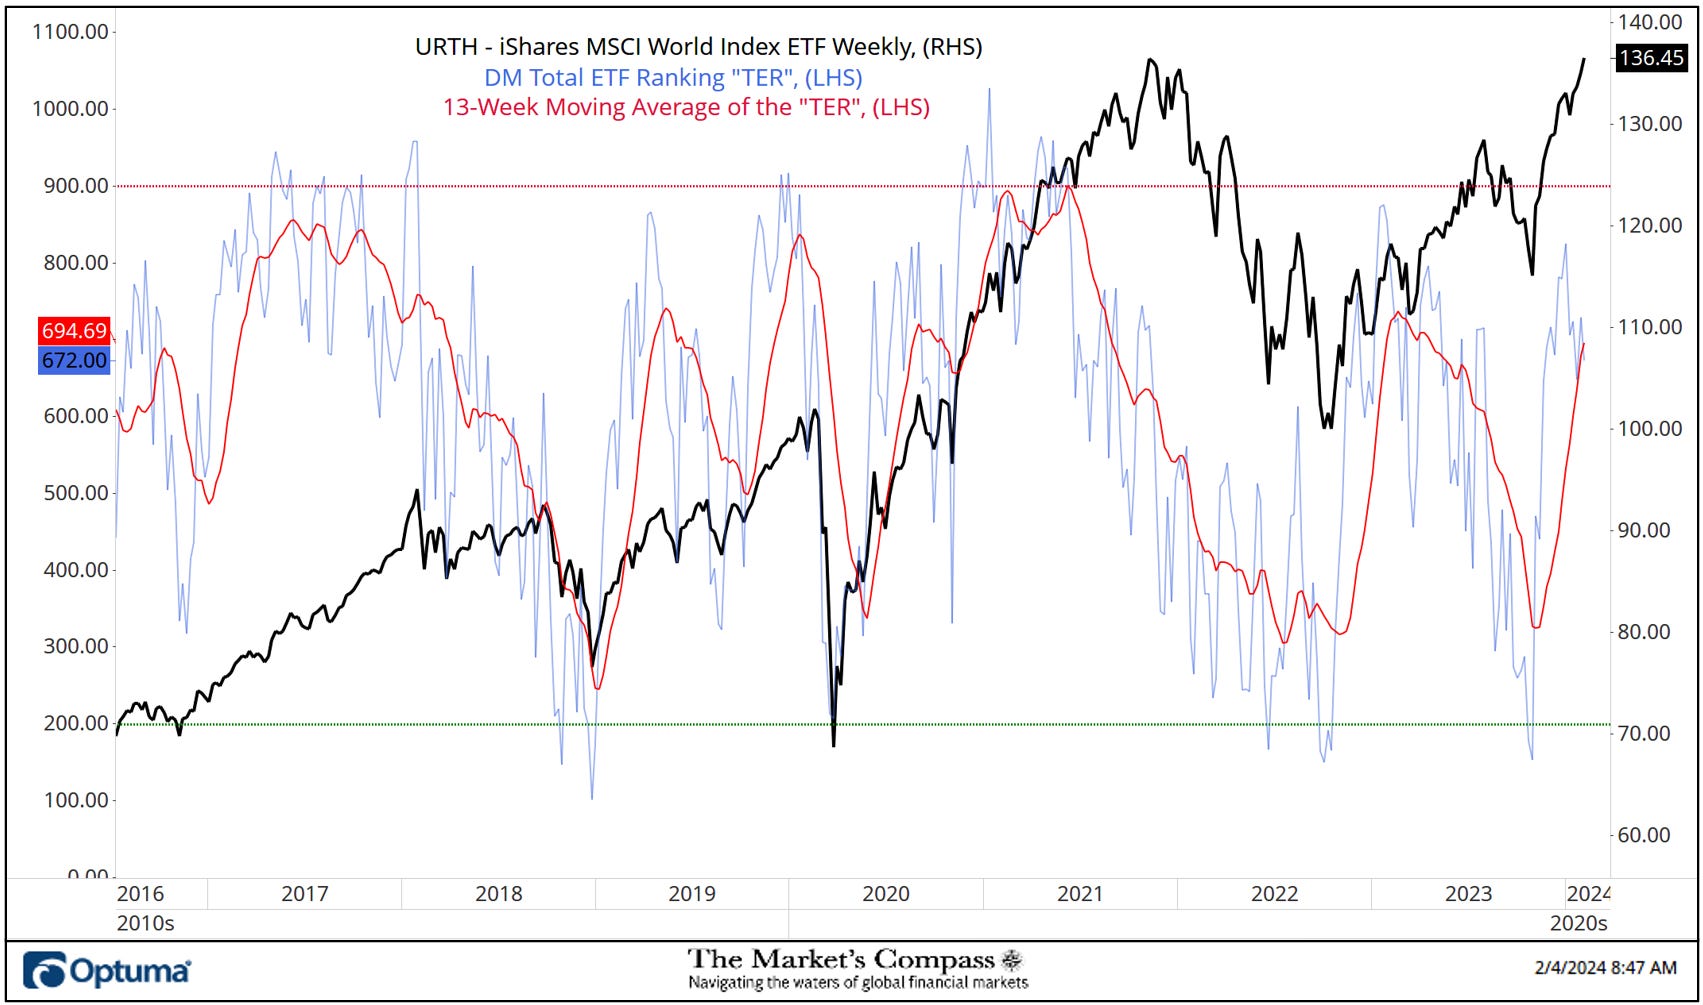
Last week was the fourth week in a row that the URTH gained ground and looked to be set to challenge potential resistance at the November 2021 high but there continues to be a budding non-confirmation of the recovery high by the DM Total ETF Ranking or “TER”. That said it should be noted that the 13-week moving average (red line) has continued to track higher. What will be seen later in the Blog, less than half of the twenty-two ETF we track gained ground on an absolute basis last week.
The Average Technical Ranking of the 22 Developed Markets Country ETFs
The Weekly Average DM Technical Ranking (“ATR”) is the average of the individual Technical Rankings of the 22 Developed Markets Country ETFs we track. Like the TER, it is a confirmation/divergence or overbought/oversold indicator.
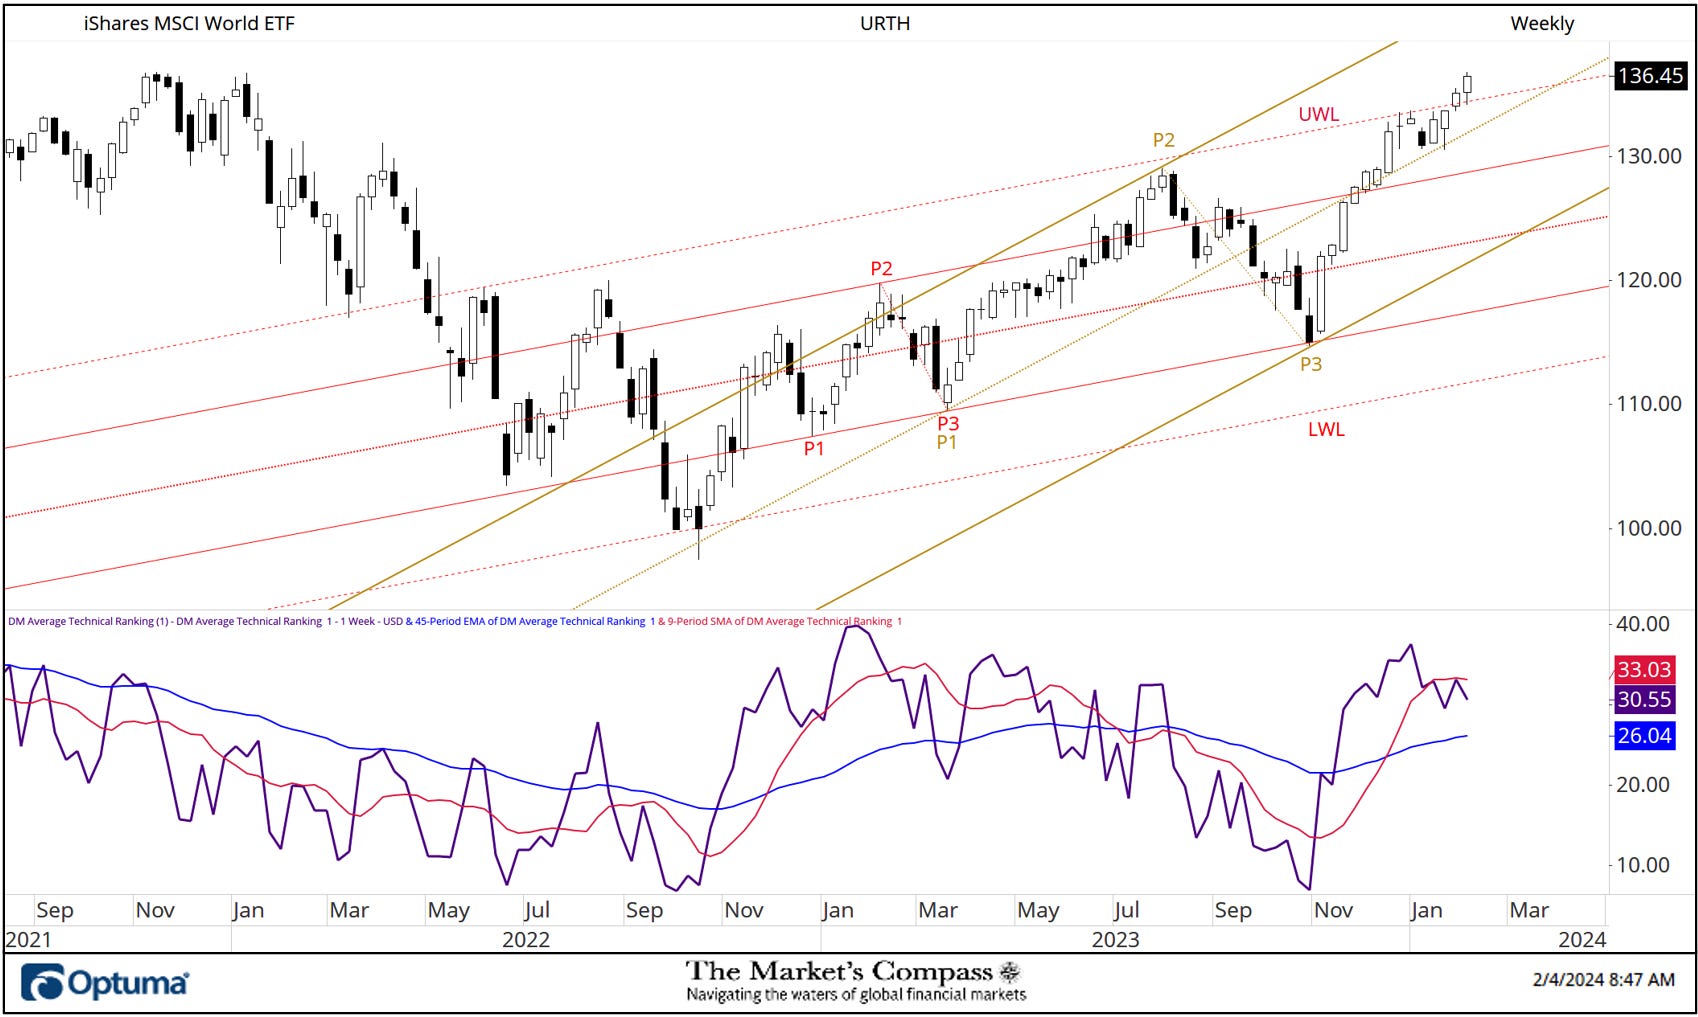
Two weeks ago, the URTH traded and closed above the Upper Warning Line (red dashed line) of the Schiff Modified Pitchfork that had capped the continuation of the rally for six weeks and last week the rally followed through to the upside but the DM Average Technical Ranking has not confirmed the move higher. The longer-term moving average (blue line) of the indicator continues to track higher but the shorter-term moving average (red line) has started to roll over and has capped the indicator for the past four weeks. I would need to see the Average DM Technical Ranking move above the 9-period ma to confirm the staying power of the rally from the gold P3 price pivot low. More on the Short-Term Technical Condition of the URTH but first…
*Does not include potential dividends
Eight Developed Markets Country ETFs gained ground on an absolute basis last week, thirteen lost ground and one was unchanged, resulting in an average absolute loss of -0.35% versus the previous week that registered an average absolute gain of +1.52%. Only four ETFs outperformed the 1.02% gain in the URTH and eighteen underperformed the gain in the iShares MSCI World ETF.
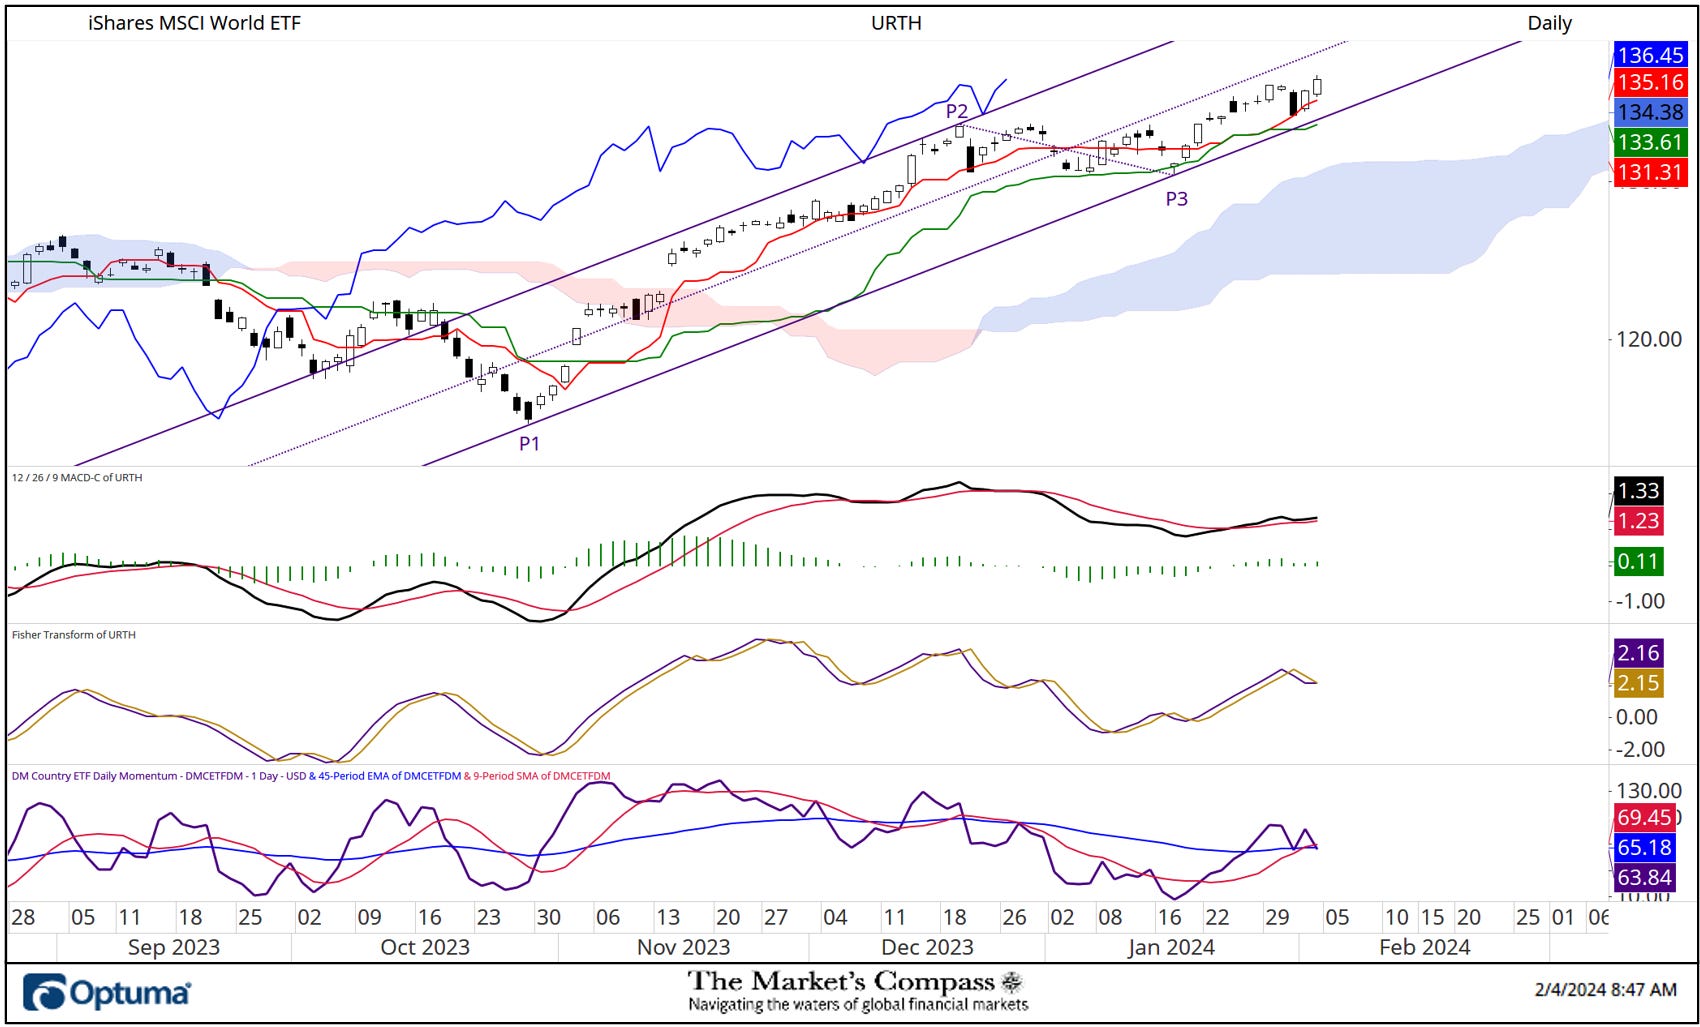
There has been a steady grind higher in the URTH for the thirteen trading sessions after the sideways to lower corrective price pattern from Violet P2 to the price pivot at Violet P3 but despite the move higher since then prices have remained trapped between the Lower Parallel (solid violet line) and the Median Line (violet dotted line) of the Schiff Modified Pitchfork (violet P1 through P3). MACD is back above its signal line but is only tracking slightly higher, but the momentum oscillator does remain in positive territory. Since the end of January, the DM Country ETF Daily Momentum / Breadth Oscillator has been anemic but has managed to hold moving average support.
*Does not including dividends
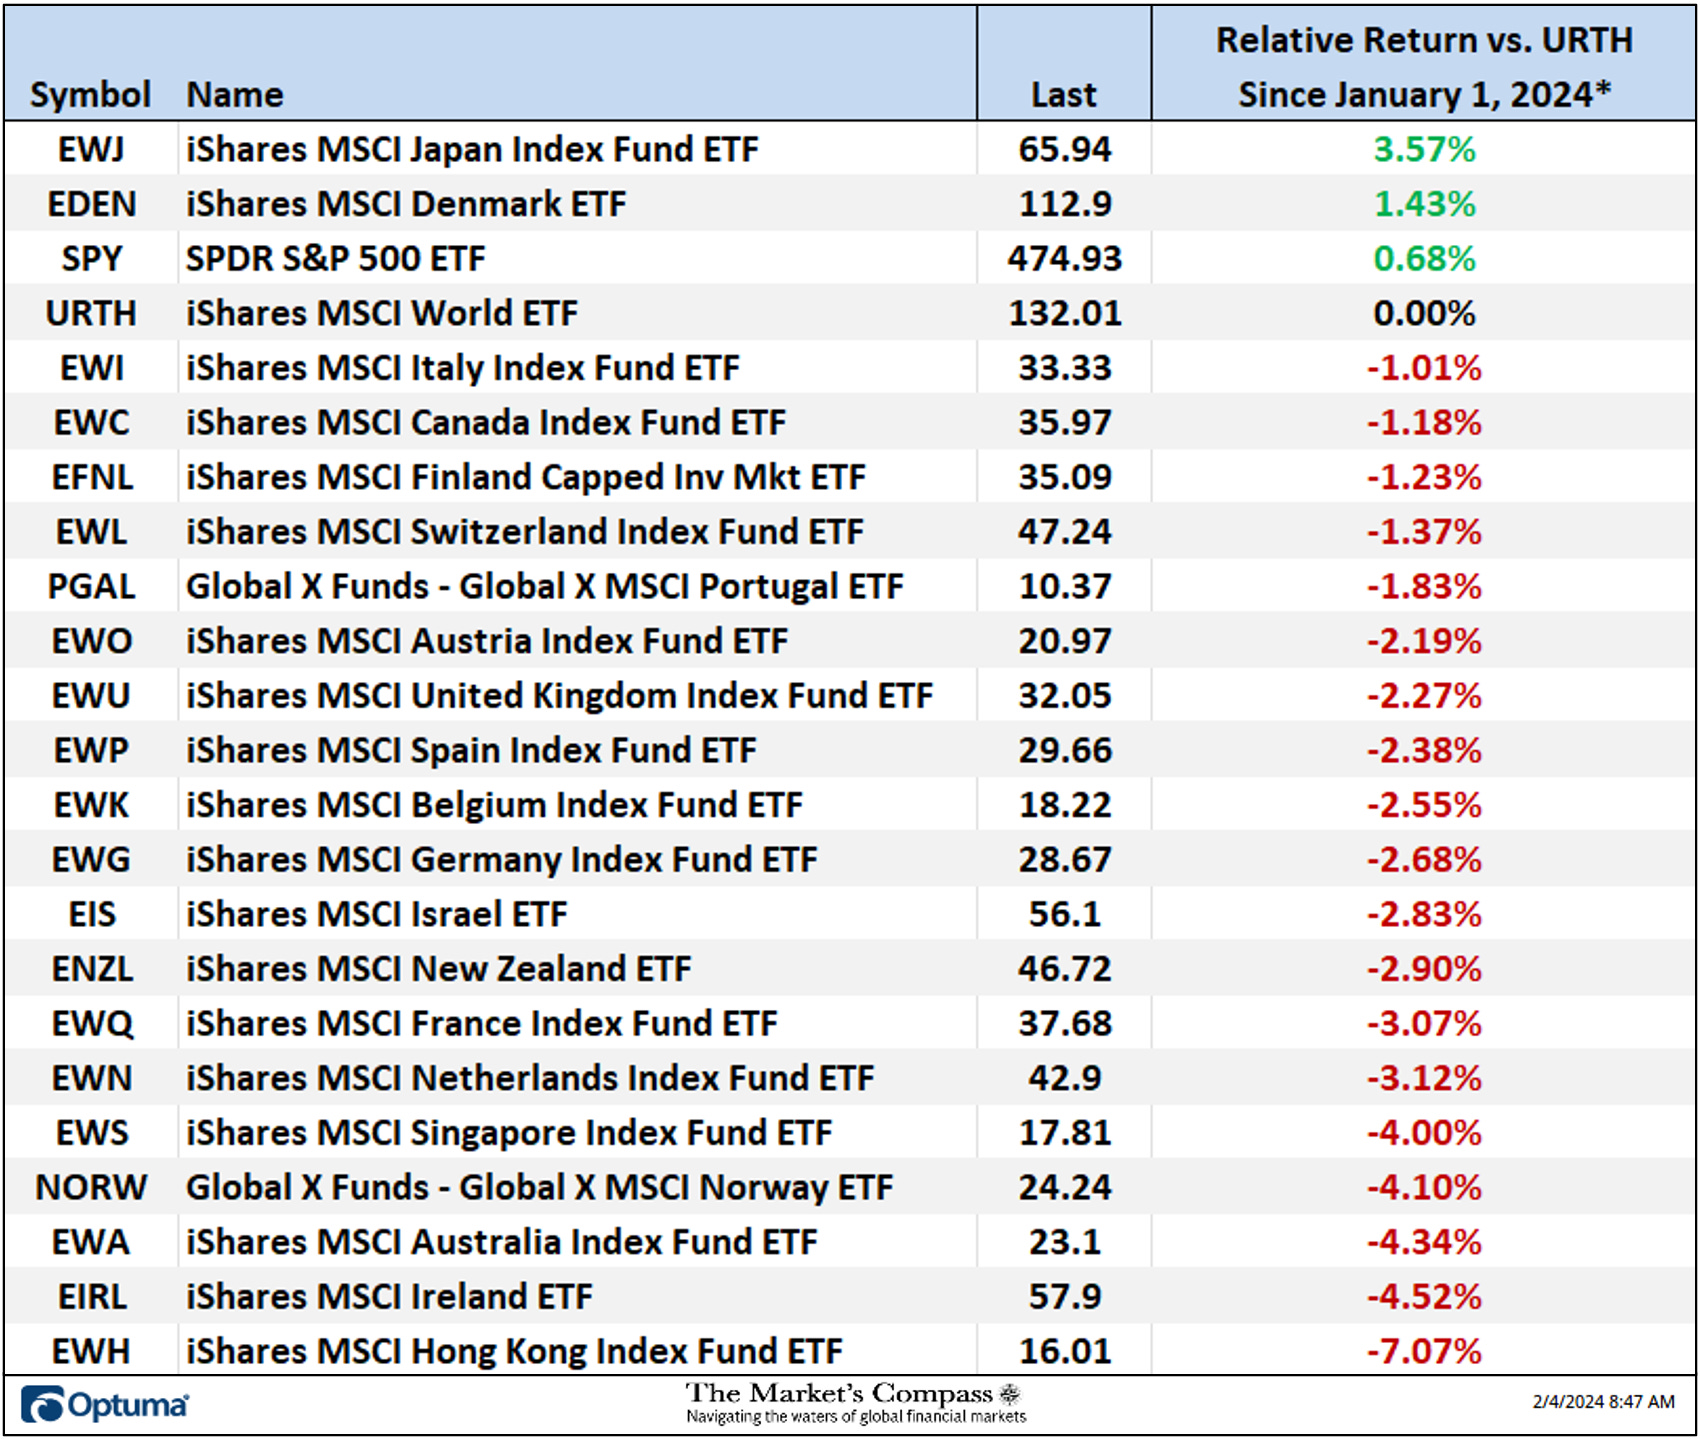
The EWJ, EDEN and SPY continue to be the only three DM Country ETF’s that are up relative to the YTD +2.58% gain in the URTH.
Charts are courtesy of Optuma. Any time series data can be imported, charted, and tested in Optuma.
To receive a 30-day trial of Optuma charting software go to…
A three part tutorial series on Andrews Pitchfork may be read at my web site…. www.themarketscompass.com
![Google Search Operators [Complete List] » Rank Math](https://rankmath.com/wp-content/uploads/2024/02/Google-Search-Operators.png "Google Search Operators [Complete List] » Rank Math")