Table of Contents
Would you believe that BrightLocal has been exploring the relationship between consumers, online reviews, and local businesses for almost 13 years?
Since 2010, we’ve seen significant developments in the perceptions of online reviews, the ways businesses engage customers to leave feedback, and the channels or platforms consumers choose to do it on.
Whilst a simple star rating may have been enough to persuade potential customers back then, our findings over the years show that the most important review factors have evolved. This, plus an increasing savviness when it comes to detecting fake reviews, and shifting perceptions of different review platforms, makes for an ever-changing landscape.
We wanted to continue exploring the perennial theme of fake reviews this year, and explore how reviews may be evolving outside of traditional platforms. So, what does the consumer review scene look like in 2023? Let’s get straight to it.
Key Findings
- 76% of consumers “regularly” read online reviews when browsing for local businesses, compared to 77% in 2021.
- The number of consumers reading online reviews “every day” fell from 34% in 2021 to 21% in 2022.
- 87% of consumers used Google to evaluate local businesses in 2022, up from 81% in 2021.
- The top industries where consumers see business reviews as most important are: Healthcare, Automotive Services, and Service Businesses/Tradespeople.
- The percentage of consumers using Facebook to evaluate local businesses has fallen for the second year running, from 54% in 2020 to 48% in 2021, and from there to 46% in 2022.
- 42% of consumers are confident they’ve seen fake reviews on Facebook in 2022, compared to 37% in 2021.
- Google is the most trusted review platform across all industries, although Tripadvisor still has its place for accommodation businesses, Yelp maintains a strong share of trust for food and drinks businesses, and BBB is trusted for businesses in professional trades and real estate industries.
- 26% of consumers were asked to leave a business review in exchange for a discount in 2022, up from 15% in 2021.
- 36% of female consumers are likely to leave a positive review for a business that they know is eco-friendly, compared to 24% of male consumers.
- Outside of standard review platforms, 35% of consumers use YouTube to find information about local businesses, 32% use Instagram, 20% use TikTok, and 35% of consumers consult their local news.
How are consumers using business reviews?
We’ve been asking consumers a number of the same questions year on year, helping us to determine trends in user behavior and benchmark the results. To begin with this year, we asked about the frequency with which consumers are searching for and reading business reviews online.
How often are consumers researching businesses online?
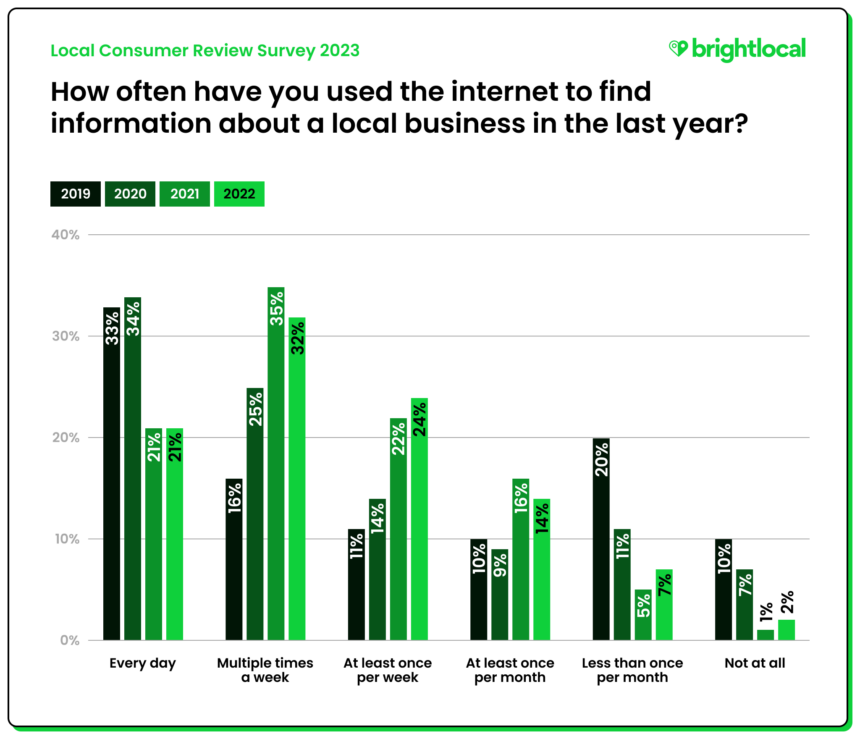
- 98% of consumers used the internet to find information about local businesses in 2022, up from 90% in 2019.
- The percentage of consumers using the internet to find information about a local business every day has remained stable, at 21%.
In 2020, 34% of consumers used the internet to gather information about local businesses every day. This figure dropped to 21% in 2021, and the percentage of people finding information about local businesses online remains static in 2022.
Despite this, last year’s Local Consumer Review Survey revealed that the general frequency in which consumers used the internet to find information about local businesses had increased. It appears the frequency of people looking for business information online decreased slightly in 2022, as 7% of consumers stated that frequency as less than once per month, compared to 5% in 2021. 2% of consumers said they have not used the internet to research local businesses at all in the last 12 months.
It’s important to note that, on the whole, these changes are slight, so the general pattern remains fairly stable. However, the minor change in frequency could be an indicator of the current economic climate and how the typical US consumer’s needs have shifted as a result.
According to Medallia, 44% of US consumers described their financial status as “worse off” in 2022 than in 2021—so, with less disposable income to spend on goods and services, there is arguably a lesser need to search for local businesses as frequently.
How often do consumers read online business reviews?
As for the consumers “regularly” reading business reviews, this figure has also remained static, holding at 41%, since 2021.
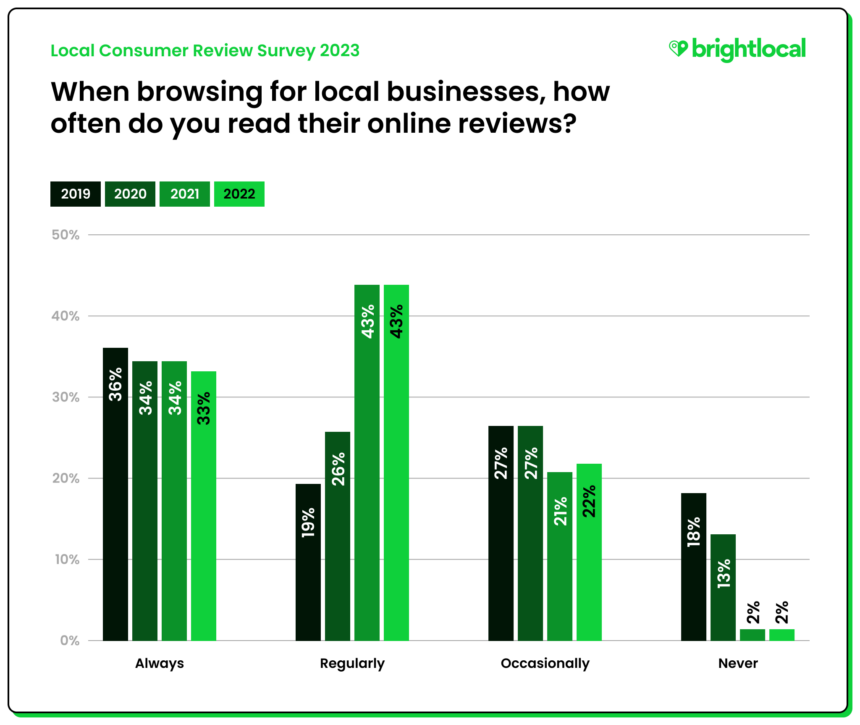
- 98% of consumers at least “occasionally” read online reviews when researching local businesses.
- 76% of people “always” or “regularly” read online reviews for local businesses.
The fact that 2022’s results are pretty similar to 2021’s suggests that consumer reliance on using the internet to read online business reviews has remained about the same, which doesn’t come as much of a surprise.
If anything, this consistency in how often people are reading reviews is good news for local businesses—those that are investing time and effort in growing their review profiles, anyway.
Where are users looking for business reviews?
For the last couple of years, we’ve been analyzing which review platforms consumers navigate to as part of their local business research.
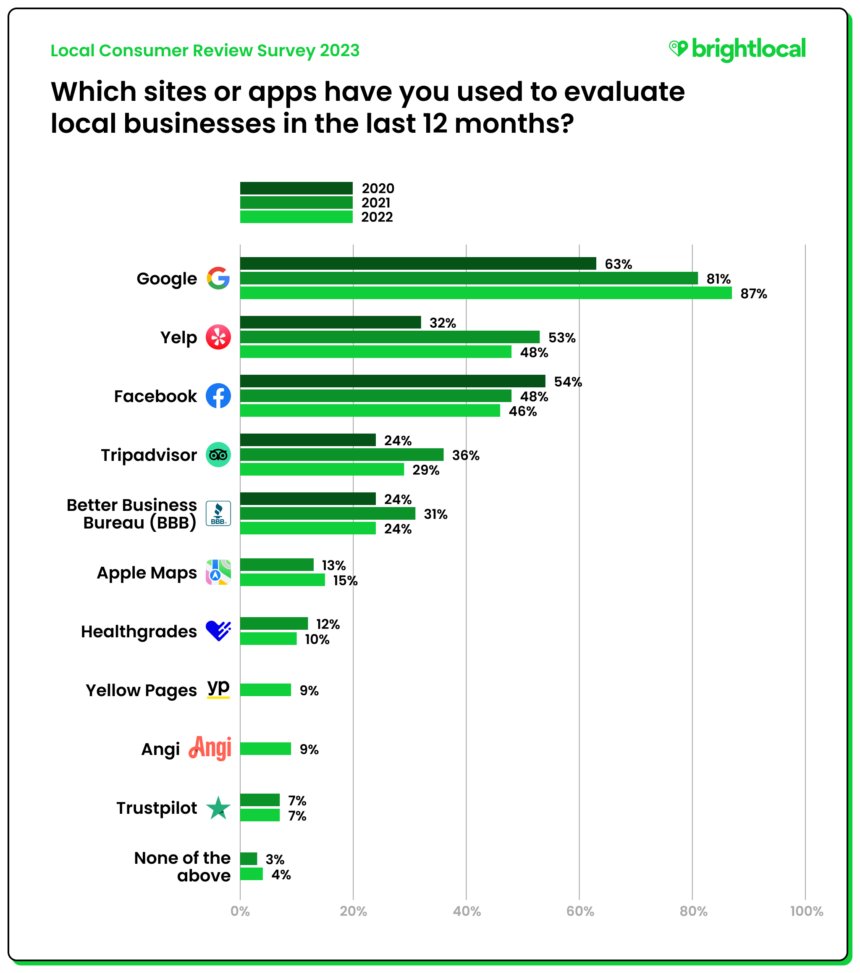
- In 2022, 87% of people used Google to research local businesses (up from 81% in 2021).
- Consumer use of Yelp to evaluate local businesses has decreased from 53% in 2021 to 48% in 2022.
- The percentage of consumers using Facebook for business reviews has decreased for the second year running, sitting at 46% in 2022.
The biggest story around review sites in 2022? It’s clear that more people are using Google to research local businesses. This rose from 63% in 2020 to 81% in 2021, and now up to 87% in 2022.
According to ReviewTracker, Google holds the largest number of reviews—at a whopping 73% of all online reviews. And, while it follows that more people would be using a site with the most reviews to search for local business information, Google also regularly tests and introduces updates to the reviews platform to improve the experience for users.
If Google can shorten the journey between search and results as much as possible, why would a user need to navigate to another review site? This impressive gain certainly goes to show that local businesses cannot afford to ignore the opportunity to claim—and maintain—their Google Business Profiles.
More people using Google to research businesses has natural implications for other leading platforms like Yelp and Facebook. Following a significant rise in 2021, the percentage of people using Yelp to research local businesses dropped from 53% to 48%.
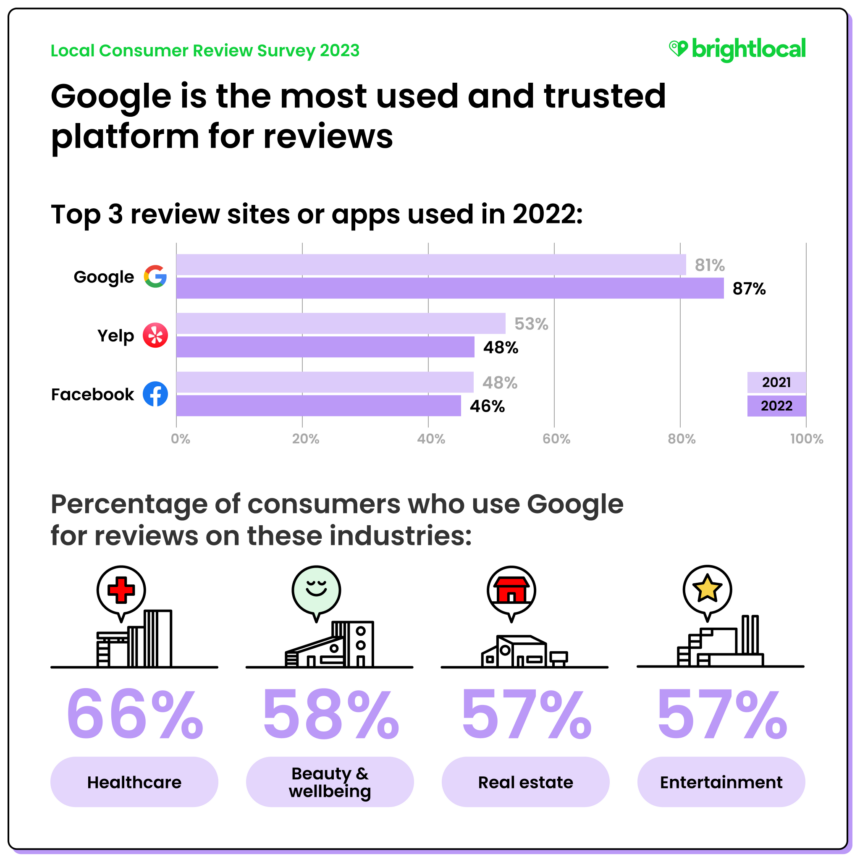
Meanwhile, following the pattern of 2021, Facebook continues to lose its share of consumers choosing it to browse business reviews. As we’ll discuss a bit later, consumer trust in the social platform has continued to fall since its many data controversies, and usage of the channel has decreased among US adults since 2019.
Although they are smaller decreases, two other notable drops came from Tripadvisor and Better Business Bureau (BBB). It’s interesting to see that fewer people used BBB to read reviews in 2022, because there is evidence to show that the platform still has its place as a trusted review site for certain industries.
Meanwhile, 29% of consumers used Tripadvisor for business reviews in 2022 compared to 36% in 2021. Given that Tripadvisor specializes in hospitality businesses and more consumers tend towards BBB for businesses in professional trades, it could be a reflection of the economy throughout 2022: did consumers just pull back in terms of ‘luxuries’ like travel and home improvements?
What types of reviews are consumers writing?
What causes someone to leave a business review? And are they more likely to write one following a positive experience with a business, or a negative one? We surveyed our consumer panel to find out what reviews they left in 2022.
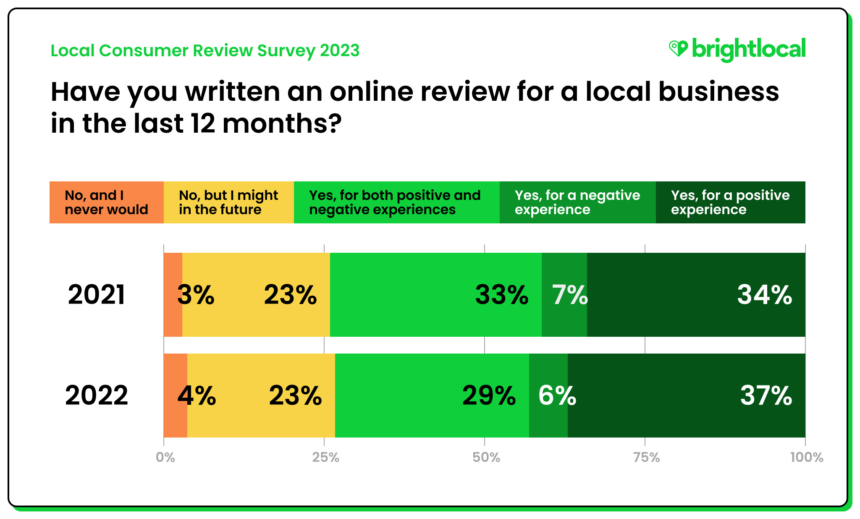
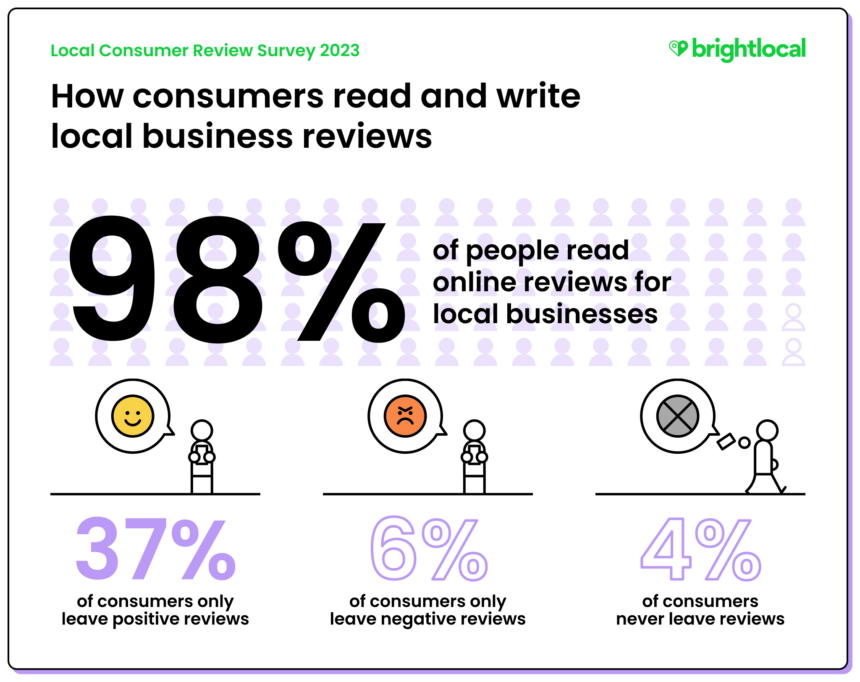
- 37% of consumers left reviews for local businesses following a positive experience in 2022.
- 95% of consumers left an online review in 2022, or would at least consider leaving one.
- 4% of consumers stated they would never leave an online review, increasing from 3% the year prior.
As you’ll note from the chart above, the percentage of consumers leaving reviews for positive experiences increased slightly year on year, from 34% to 37%, while the percentage of consumers leaving reviews for negative experiences shrunk by 1%.
Why are people more inclined to leave reviews of positive experiences these days? Well, the economic difficulties of 2022 have thrown many local businesses into turmoil, so it could be the case that consumers are more aware of the implications that negative reviews can have on local businesses. With this in mind, they may feel more forgiving in the face of a negative experience and willing to think twice before leaving a bad review.
What influences consumers to write a positive review?
When we examine the factors that are most likely to influence a consumer to leave a review, we can see a pattern around positive experiences.
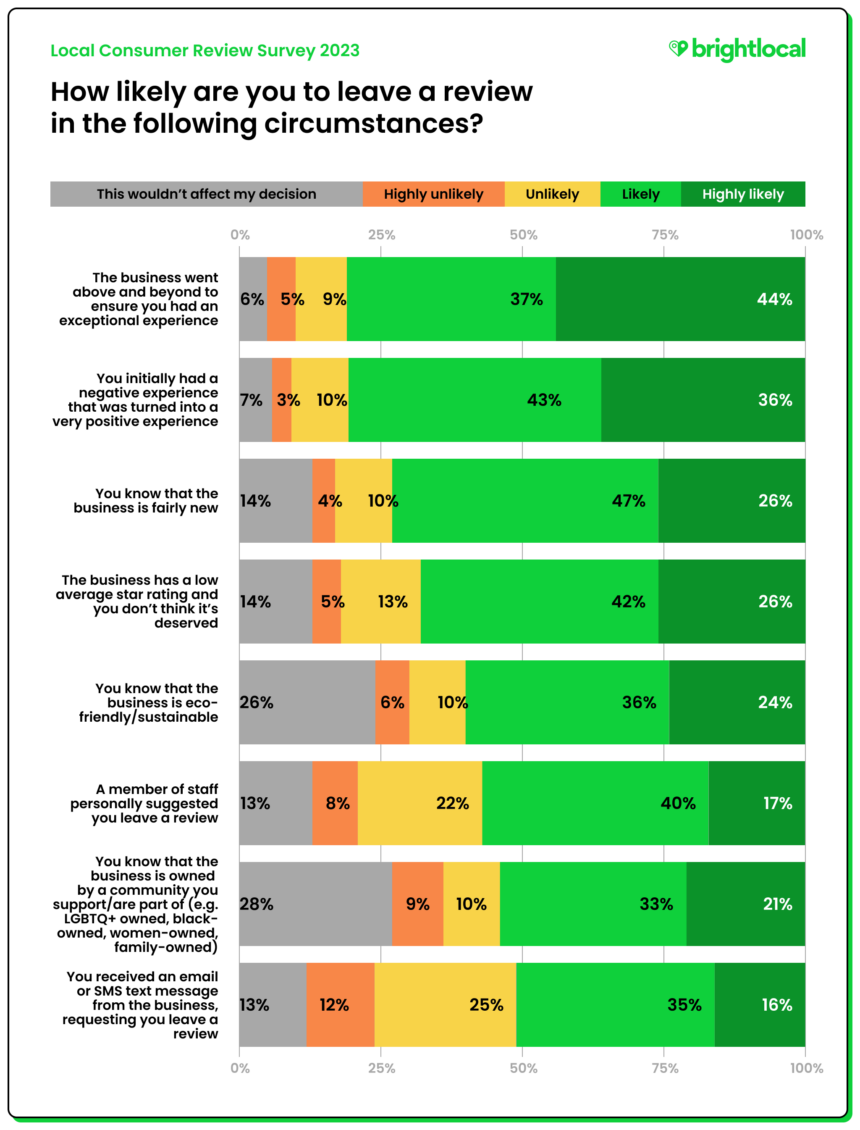
- 81% of consumers are “likely” or “highly likely” to leave a positive review if they feel the business went above and beyond to ensure an exceptional experience.
- 79% of people would be “likely” or “highly likely” to leave a positive online review if the business had turned an initially negative experience into a positive one.
- 73% of people are “likely” or “highly likely” to leave a positive review if they know that the business is fairly new.
- Knowing that a business is eco-friendly or owned by a community that consumers support are the two factors that most consumers said would not impact their decision.
Naturally, the top two factors that are most likely to influence people to leave a positive review are similar in that they center around the experience provided by the business. Following those, there’s a theme of consumers wanting to show support for businesses and give them a chance (e.g. ‘the business is fairly new’, ‘the business has an undeservedly low star rating’).
As discussed above, these reasons appear to support the theory that consumers might be feeling more generous towards local businesses during economic uncertainty.
This year, we added two new options to the survey questions: one around supporting communities and the other around eco-friendliness. In writing these questions, we hypothesized that consumers would have stronger opinions about communities and sustainability in 2022. In fact, these were the two answers that most consumers claimed would not affect their decision to leave a review.
Digging deeper into these responses, we can see more of a pattern when it comes to what types of consumers would consider these aspects more strongly as reasons to write a review.
| Likely | Unlikely | This wouldn’t affect my decision | |
|---|---|---|---|
| Male | 20% | 12% | 12% |
| Female | 33% | 7% | 16% |
Examining demographic factors, you can see above that female consumers are more likely (33%) to leave a positive review than male consumers (20%) when the business is owned by a community they resonate with.
(Of course, it could be that this data is skewed by the fact that one of the attributes mentioned—as per Google Business Profile attributes—is ‘female-owned’.)
Statistics around minority-owned businesses in the US highlight the following:
With substantial gaps in business ownership and earnings within minority communities, it would make sense that female consumers might be more aware of the challenges marginalized groups face. Therefore, they may be more likely to consider business ownership as a factor that would influence them to leave a local business review.
Note: In last year’s survey, ‘family-owned’ stood alone as its own factor. That year, 74% of consumers stated that they would be likely to leave a positive review knowing this. In 2023, we consolidated this into the community question, where 54% of people indicated they would likely leave a positive review.
A sadly notable failing of our chosen survey tool (more detail in the Methodology below) is that it only asks participants for binary genders. This is something we’ll be looking into resolving in future research.
How do consumers respond to review requests from businesses?
As marketers and business owners, you’ll know that you can’t always rely on a consumer going out of their way to leave a business review. This is where timely prompts with reputation management tools—or clever review campaigns—come in incredibly handy.
We asked the consumer panel how often they responded to business requests for reviews in 2022, as well as the methods they are most likely to respond to.
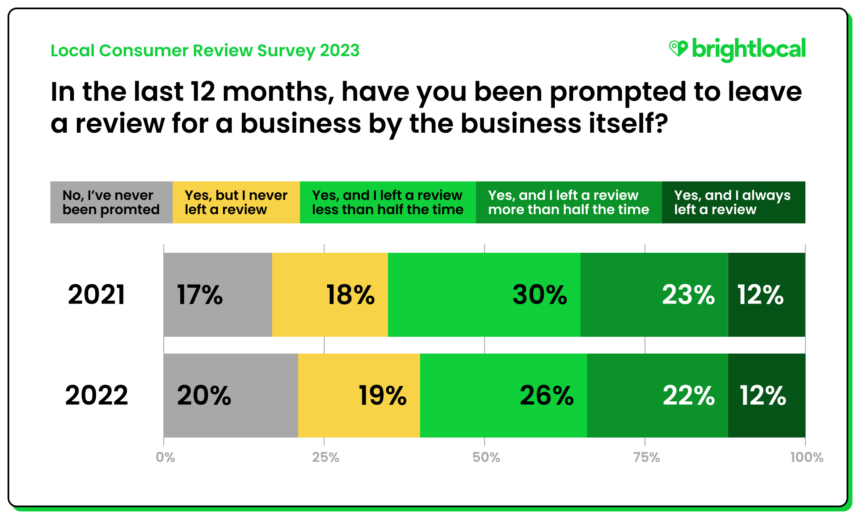
- 80% of consumers were prompted by local businesses to leave a review in 2022.
- 65% of consumers left reviews in response to requests from a business.
- 19% of consumers did not leave a review after being prompted to do so by a business.
We asked consumers about the methods of review requests that they would most likely respond to, from in-person or on-premise tactics to follow-up emails and text messages.
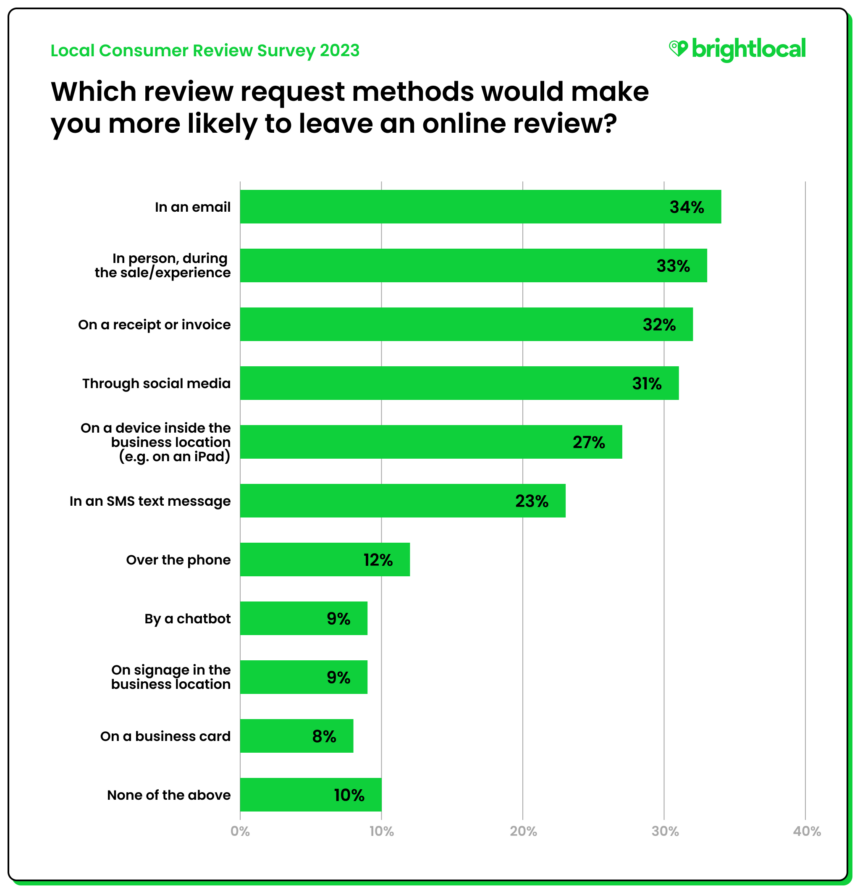
- 34% of consumers said they would be likely to leave a review if requested to do so by email.
- 33% of people would likely leave a review if they were asked to in person, during the business experience or transaction.
- 32% of consumers said that a receipt or invoice would be an effective way of inciting a review.
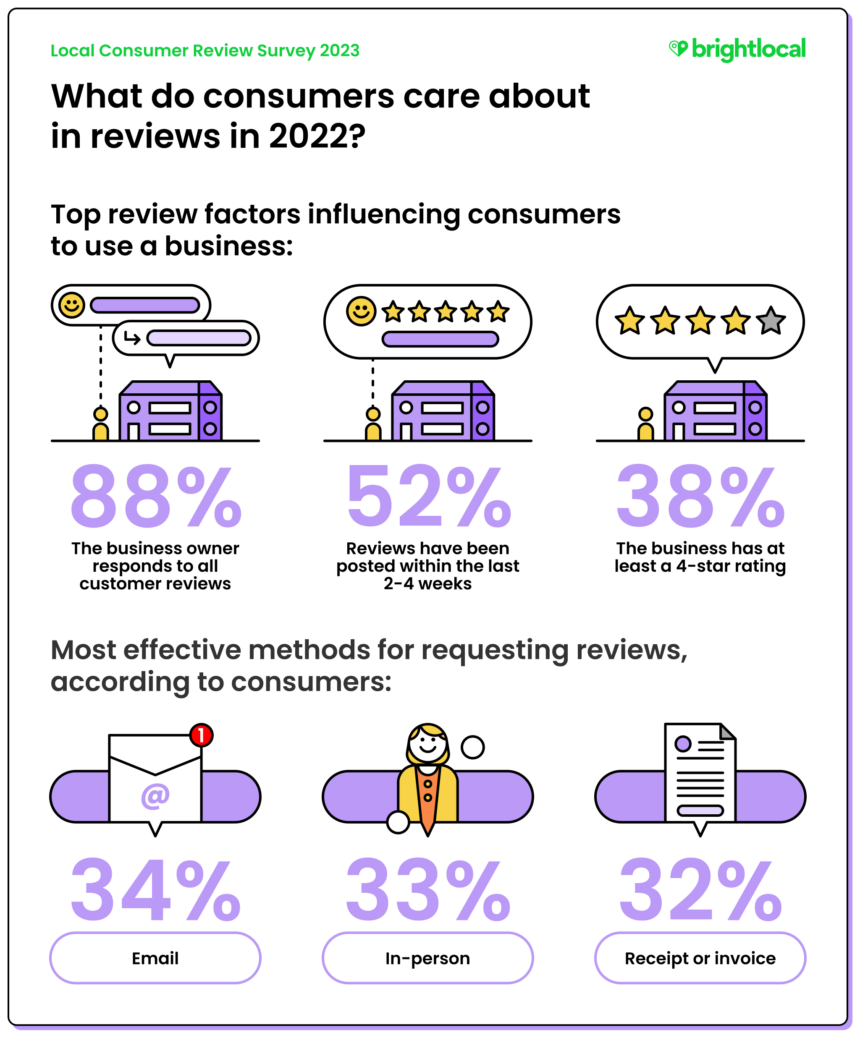
The top method for requesting reviews is email, as 34% of customers stated they would be likely to leave a review this way. This is a significant finding as it shows just how effective a timely email reminder is.
However, as you’ll no doubt be aware, email inboxes are highly competitive spaces; according to Statista, over 306 billion emails are sent every day. So keep this fierce competition in mind when sending your review requests.
In-person experiences came in as the second-most-popular way for businesses to request reviews from customers. As we discussed earlier, businesses going above and beyond stand the best chance of securing positive reviews. This new data goes further to highlight the influence that your teams and employees can have on the customer’s decision to leave a review.
Interestingly, receipts and invoices came out as the third most popular method for review requests, while business cards and on-premise signage were the two that ranked lowest.
So, while we’re not necessarily recommending you abandon business card design and signage, there is a clear finding that utilizing space on important documentation like receipts and invoices goes much further than just for accounting or tax purposes.
Additionally, businesses that are highly focused on customer service could find that combining in-person requests with instructions or QR codes on receipts is very powerful.
Do business responses to reviews affect consumers’ opinions?
As we’ll learn more about later, consumers like it when businesses respond to reviews.
But what if that business owner only responds to positive reviews? Does the type of response affect a consumer’s perception of the business?
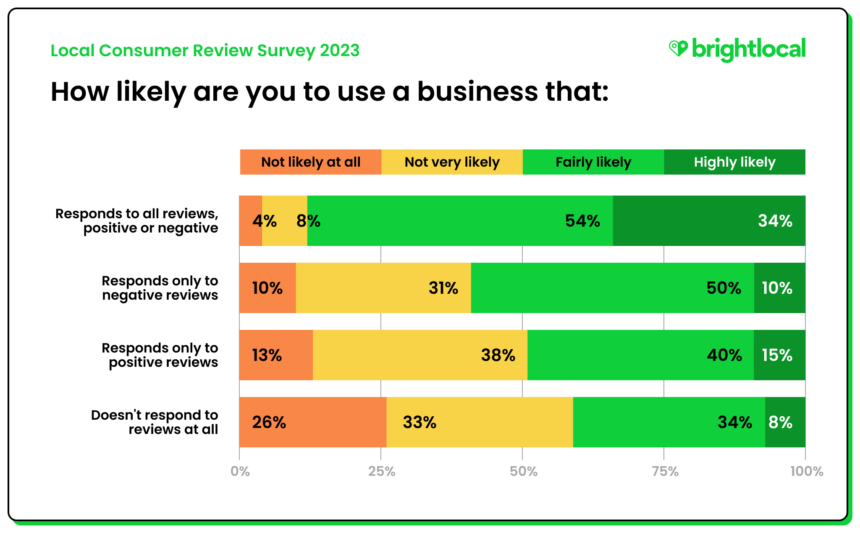
- 88% of consumers are likely to use a business if they can see the business owner responds to all reviews, whether positive or negative.
- 60% of consumers would likely use a business where the owner responds to only negative reviews, while 50% said they would use a business where the owner only responds to positive reviews.
- 42% of people stated they would still use a business that does not respond to its online reviews.
Only 12% of people state they would not be affected by a business owner responding to both positive and negative reviews, which highlights the continued importance of taking the time to read and respond to your business reviews.
Additionally, with the finding that consumers will likely leave reviews where an initially negative experience had been turned into a positive one, we can assume that consumers are aware and appreciative of businesses’ efforts to make amends when they fall short of expectations.
A higher percentage of consumers would consider using businesses that only respond to negative reviews (60%) than those that only respond to positive reviews (50%). This finding might also suggest that people see the efforts to respond to poor experiences in a positive light.
It’s worth noting that 42% of consumers are still likely to use a business that doesn’t respond to any of its reviews. However, this doesn’t mean you should be resting on your laurels! Essentially, consumers are more than twice as likely to consider your business if you’re taking the time to respond to all types of reviews.
What matters to consumers about online reviews?
So far, we’ve examined where and how often people are reading reviews, and in what circumstances they’re writing their own—but what elements of review content can convince someone to use a local business?
We wanted to find out how important reviews are for businesses across different industries, as well as whether star ratings are still seen as important as other factors.
Does the importance of online reviews vary by industry?
In 2022’s survey, consumers highlighted service businesses and tradespersons, care services, and healthcare as the industries in which business reviews were most important to them.
As it was noted at the time, high-risk industries—or those often used in unplanned situations and emergencies, like healthcare and care services—unsurprisingly came out on top. It’s worth remembering that those results analyzed 2021 behavior, when the world was still very much in the middle of the pandemic.
This time, we introduced several new industries:
- Travel and transportation (e.g. travel agents, hotels, taxi services)
- Pet services (e.g. veterinary care, grooming, walkers/boarding)
- Beauty and wellbeing (e.g. salons, tattoo studios, gyms, spas)
- Real estate (e.g. realtors, brokers, interior design, architecture)
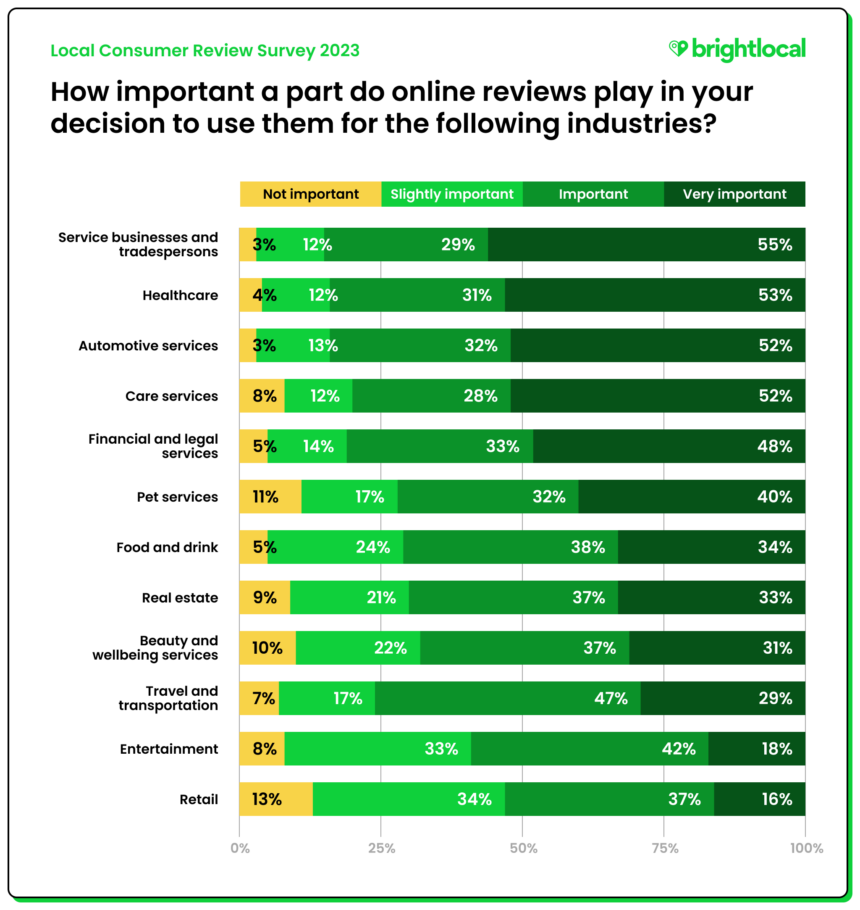
- The top industries in which consumers consider reviews as “important” or “very important” to their decision-making were: services and trades, healthcare, and automotive services.
- 81% of consumers feel that reviews are “important” or “very important” in the financial and legal sector (up from 66% in 2022).
- 80% of people said that reviews for care service businesses were “important” or “very important” for their decision-making.
- As with 2022’s findings, retail is still seen as the industry where business reviews have the lowest importance to consumers.
The most interesting change trend we’re seeing here is the year-on-year increase in the importance of reviews of finance and legal businesses. This change may have been driven by squeezes in consumer spending power due to rising inflation and increasing reliance on credit services, leading to more seeking financial and legal services.
At the very least, these economic factors will have likely influenced the typical consumer’s perspective of the importance of these services—and therefore their business reviews.
Although there is no comparable data for travel and transportation, 76% of consumers ranked these types of business reviews as important. As well as considering local transport services, this bracket mentions travel agents. Deloitte notes that demand for travel services in 2021 and 2022 showed strong signs of recovery since the pandemic and, while we may be a long way from the travel restrictions faced back then, consumers will likely look to professionals like local travel agents for up-to-date advice.
What review factors influence consumer decisions when choosing a local business?
When it comes to reviews, consumers need to be reassured by what they see. But that might look different for different people. Does seeing an average rating cut it for making a decision, or do they need to read into the details?
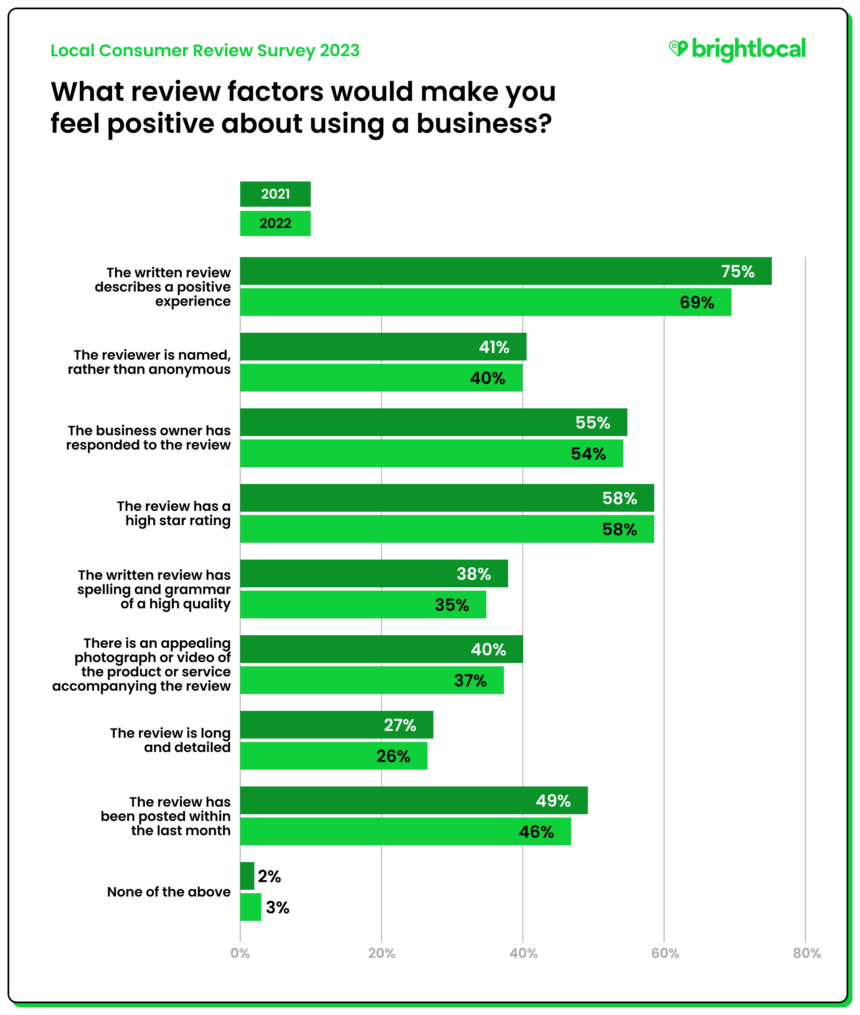
- 69% of consumers would feel positive about using a business with reviews describing a positive experience.
- A high star rating would make 58% of people feel positive about choosing a local business.
- 54% of consumers would feel positive about using a business when the owner responds to reviews.
The pattern of responses in 2022 (shown above) remains consistent with those of 2021, albeit with slight drops in percentage points across the options.
Although it might seem obvious that most consumers see reviews describing a good experience as a positive indicator, it emphasizes the point that consumers are paying attention to the written content of the review itself.
However, 74% of people did not indicate a lengthy or detailed review as important in their decision-making. Why is this interesting? Well, once upon a time, lengthy essay-like reviews were often written and read on the likes of Tripadvisor, but we can see that the way consumers engage with review content in 2023 has shifted.
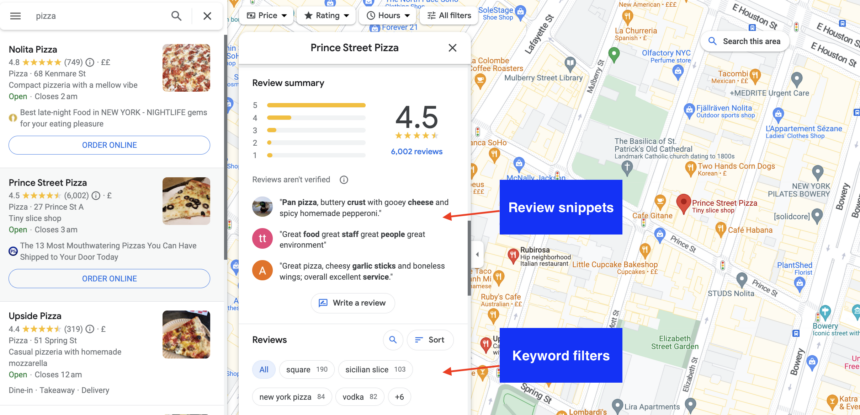
Although, as marketers, we can’t control the content of consumer reviews (and absolutely should not try to, but more on that later!), it does highlight the importance of aspects like keywords that many review platforms utilize to assist consumers.
For example, Google enables filters based on keywords in reviews, and displays snippets of key information, allowing people to quickly find the reviews that are most relevant to their needs.
How important is the average star rating in 2023?
If 58% of consumers feel that a high star rating would make them feel positive about using a business (as seen above), then what do they consider “high”?
We asked consumers what minimum average star rating they would expect to see before they considered using a business. But this year, we also considered the option that a star rating might not be important to some consumers at all.
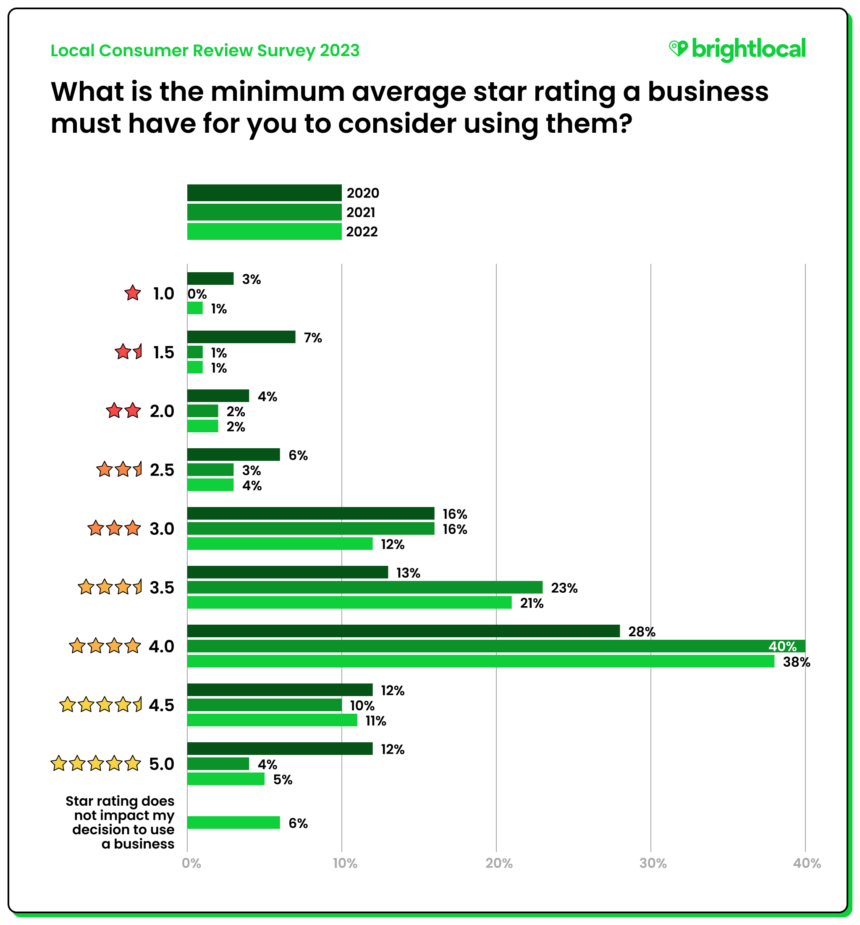
- 87% of consumers would not consider a business with an average rating below 3 stars.
- 38% of consumers expect a local business to have a minimum average of 4 stars before they would consider using it.
- 6% of consumers said that an average star rating does not impact their decision to use a local business.
It’s clear that, for those who see high star ratings as important, 4 stars and above is the expectation. But with 21% of people happy to accept 3.5-star ratings and 6% saying that star rating isn’t important to them at all, some readers aren’t just taking star ratings at face value, and clearly do assess supporting review content.
The average rating for businesses on Yelp stands somewhere between 4.5-5 stars. So, while consumers may be willing to consider businesses with lower ratings, it’s worth considering how lower ratings could affect your business visibility and discoverability on these platforms.
How much do consumers trust online business reviews?
It’s all very well studying how people use business reviews, but can we measure how much they trust what they’re reading? And how do business reviews stack up against the recommendations of others—such as personal connections, influencers, or professional reviews?
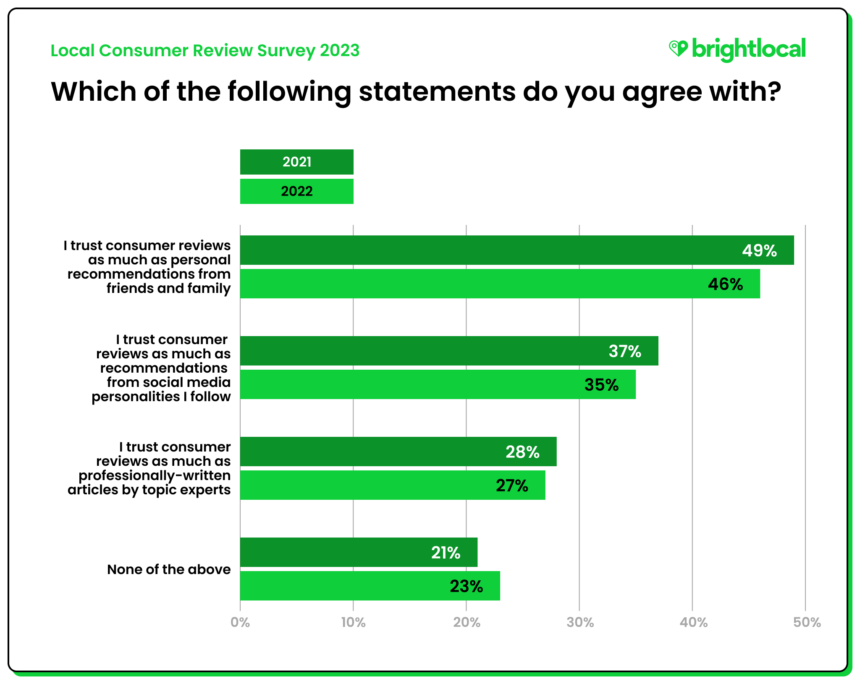
- 46% of consumers feel that online business reviews are as trustworthy as personal recommendations from friends or family (down from 49% in 2021).
- 35% of people trust consumer reviews as much as recommendations from social personalities (down from 37% in 2021).
- 27% of consumers trust online reviews as much as professional reviews (down from 28% in 2021).
Comparing the results with last year’s findings, we can see that results have fallen slightly in each area. This could suggest that consumers have become more suspicious of the content in online reviews or that they are increasingly placing more importance on personal recommendations.
However, the finding that almost half of consumers trust consumer reviews as much as personal recommendations from family and friends should still be seen as positive. It highlights the relationship between real experiences and how consumers relate to these types of reviews, compared to those of influencers or experts.
On that theme, more consumers trust recommendations from social personalities (35%) as much as online reviews than those trusting professional reviews (27%). Although the relatability of social personalities could be a whole topic of discussion in itself, it further suggests that consumers are looking for realistic comparisons when searching for business information.
Does trust in reviews vary by review platform?
While we know that Google is the most frequently used platform for reviews, is it also the most trusted? Do people’s perceptions of trustworthiness vary by platform—and does this vary by business type or industry?
We asked consumers which of the market-leading review platforms they would be most likely to trust for businesses in different industries.
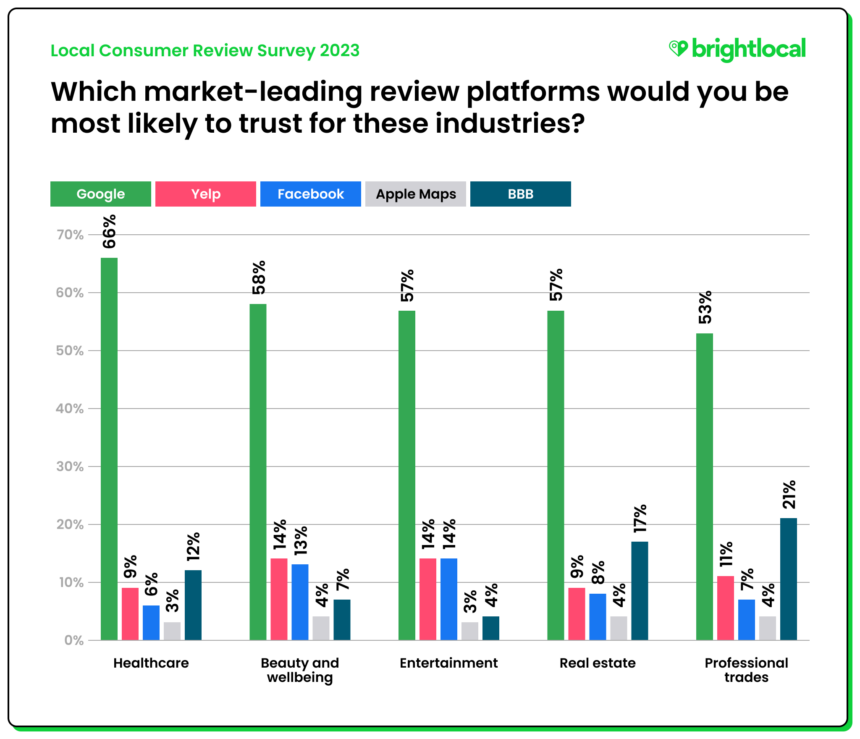
- Google is the most trusted review platform across all industries.
- Better Business Bureau (BBB) still clearly has a place among more professional trades and businesses relating to property.
It’s a clear picture. Google is perceived as the most trustworthy review platform for businesses across all industries. Although when it comes to hospitality businesses, such as those specializing in accommodation, there is a review platform that rivals Google: Tripadvisor.
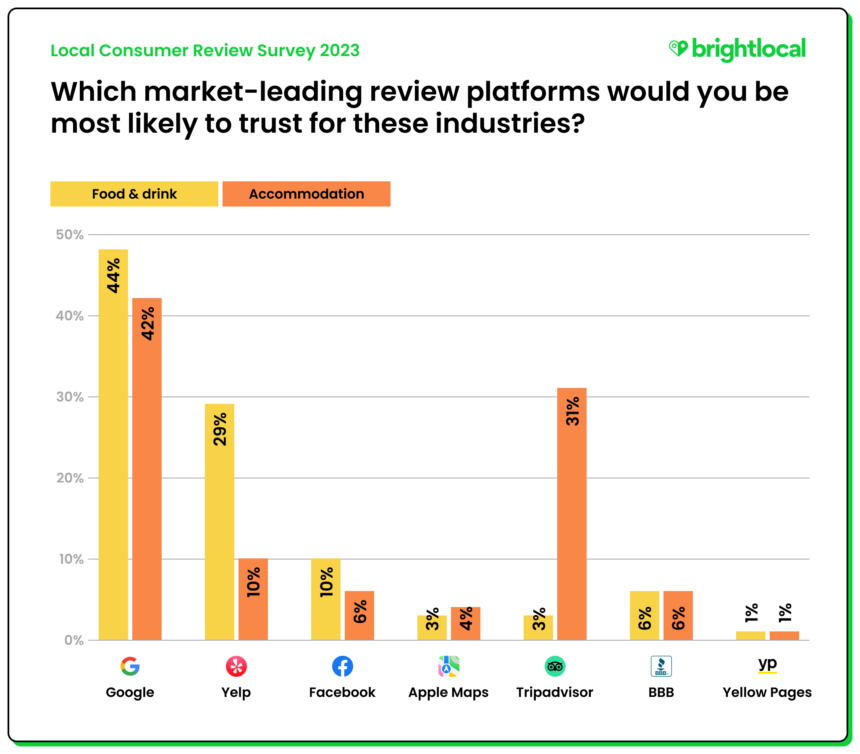
- 42% of consumers would be most likely to trust Google for accommodation reviews
- 31% of consumers would trust Tripadvisor most for accommodation reviews
We wanted to dive a little deeper into the data around hospitality businesses, which you can see in the chart above. Considering Tripadvisor specializes in tourism, covering food and drink, accommodation, entertainment, and even landmarks, it is interesting to note that it is only considered a highly trusted platform for accommodation, and much less so for food and drinks.
Google and Yelp lead the way as far as food and drink businesses are concerned, but there may be other elements taking away from Tripadvisor’s authority. With how popular visual social media platforms tend to be for food and drink discovery, as well as third-party delivery apps containing their own review systems, the choice for browsing has widened considerably beyond Tripadvisor, while the same hasn’t happened in nearly as great a scale for hotels and accommodation.
What other platforms do consumers use for business information?
As social platforms like TikTok skyrocket in popularity, and almost act as search engines in their own right, we wanted to find out where else people might be looking online for information about local businesses.
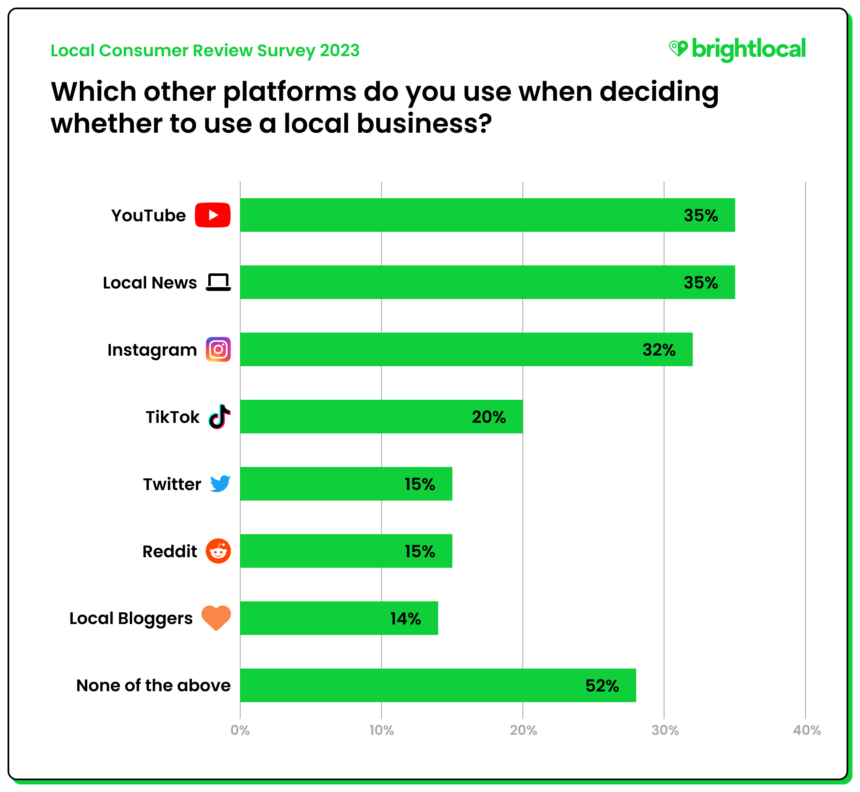
- YouTube and local news are the top two channels that consumers use to find out about local businesses outside of typical review platforms, with 35% and 35% using them, respectively.
- 32% of people use Instagram when deciding to use a local business.
- 20% of consumers consult TikTok when deciding to use a local business.
It was interesting to discover that 35% of consumers consult local news platforms as sources of information about local businesses. While this question doesn’t dig into the specifics around ‘local news’ featuring local PR or its acting as more of a business directory, it goes to show that some of the more traditional methods like local news aren’t to be dismissed.
YouTube and Instagram came in as the other top two channels for business discovery which, given their highly visual nature and focus on video content, is good for businesses to consider. While you can’t control the nature of the content that users might be posting to these channels, you certainly can take control of your own social presence and aim to get your content seen and shared by your customers.
With Instagram, ensuring business information is set up correctly can boost your visibility on its maps feature and makes it easier for users to tag their photos with your location.
For now, 20% of consumers said they look for business information on TikTok. Considering our sample did not contain any consumers under the age of 18, and TikTok’s relative newness as a social platform, this is quite an impressive figure. There is a lot of discussion around the adoption of TikTok for search, so I’d expect the number of consumers using it for local business discovery to grow by 2024’s survey.
Finally, 28% of consumers stated that they don’t use any of the alternative methods we presented for finding local business information. It could be that there are alternatives they do use that we had not listed, such as service booking apps. But it might also suggest that they don’t see a need to look outside of review platforms. So a takeaway here is: yes, diversifying your online presence is good, but that shouldn’t take away from your efforts in traditional review campaigns.
Where have people seen fake business reviews?
Of course, we can’t begin to talk about trust without raising the big issue of fake reviews. We’ve been studying consumer perceptions of fake reviews since 2017, and it’s fair to say the issue has only grown in prominence since then. Some platforms, more than others, are fighting back against the issue of fake, misleading or even potentially harmful reviews.
The recently issued 2022 Yelp Trust and Safety Report highlights the actions taken throughout 2022 to protect consumers from misinformation and maintain the integrity of its reviews. The report outlines the software and moderation processes Yelp uses to assess usefulness of content, and details the key reasons for review removal. 25% of over 206,000 reviews were found not to be detailing first-hand customer experiences!
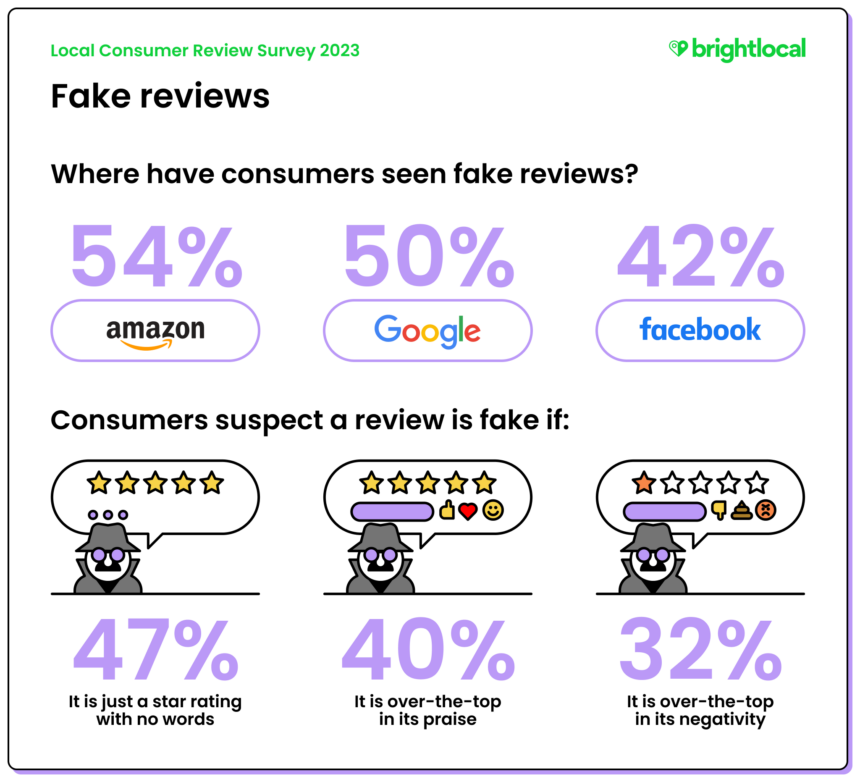
As the digital landscape continues to evolve, it’s important to measure the perception of trust across specific platforms, so we asked consumers where they feel confident they’ve seen a fake business review.
We’ve continued to include Amazon in this question as, although not strictly a business review site, it is often at the forefront of news around fake product reviews—and provides a good (read: bad) example of how sellers can incentivize fake reviews.
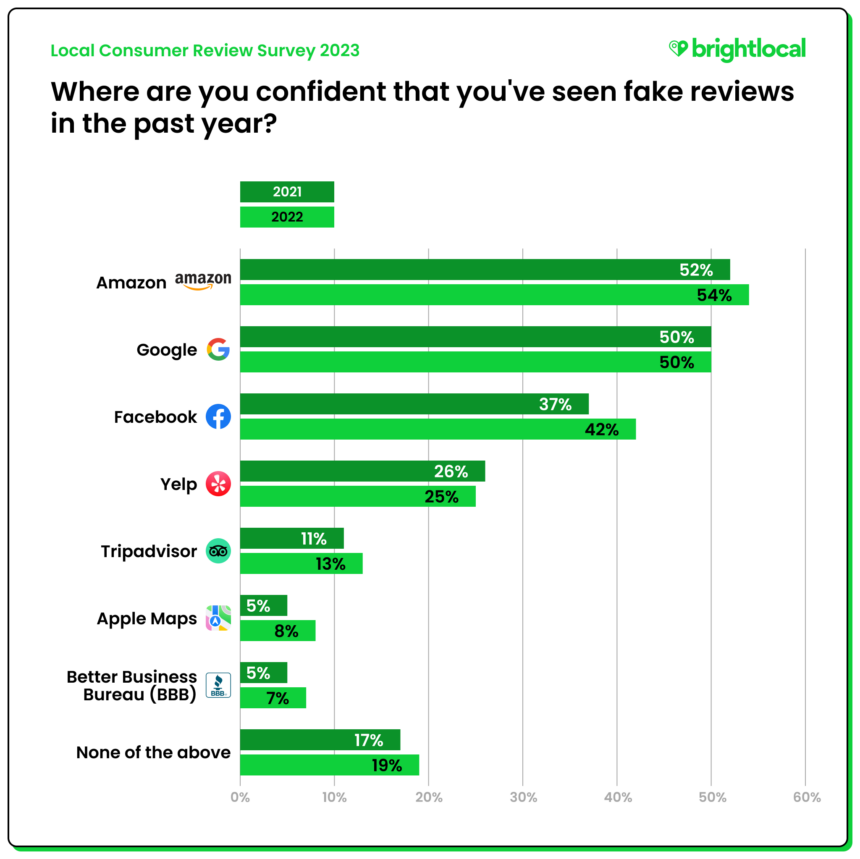
- 54% of consumers are confident that they saw fake reviews on Amazon in 2022, up from 52% in 2021.
- 50% of consumers saw fake reviews on Google in 2022, remaining static from 2021.
- 42% of consumers said they’d seen fake reviews on Facebook in 2022, up from 37% in 2021.
Unsurprisingly, Amazon came out as the top website for suspected fake reviews again, with the percentage increasing slightly year on year. More interesting, however, is the finding that a far larger proportion of consumers are confident they’ve seen fake reviews on Facebook in 2022, rising from 37% in 2021 to 42%.
Coinciding with our finding that fewer consumers are using Facebook as a review platform, it’s fair to say that overall trust in the platform has dwindled for another year. Business Intelligence statistics show that US consumer trust in Facebook has fallen more significantly in 2022 than in other social networks, with 82% of consumers unable to trust the giant when it comes to privacy and data.
Google remains static at 50% and, given the sheer size of the platform, as well as the number of consumers using it regularly, it doesn’t really come as a surprise that people see fake reviews there.
What’s more interesting is that, given the number of consumers saying they’ve seen fake reviews there, Google still stands as the most used website for local business reviews, as well as the most trusted across industries. All of this feels like it’s reinforcing the fact that consumers are more switched on and take care in assessing the content of the reviews they’re reading.
We also asked what factors might make people suspicious that the review content they’re seeing is fake.
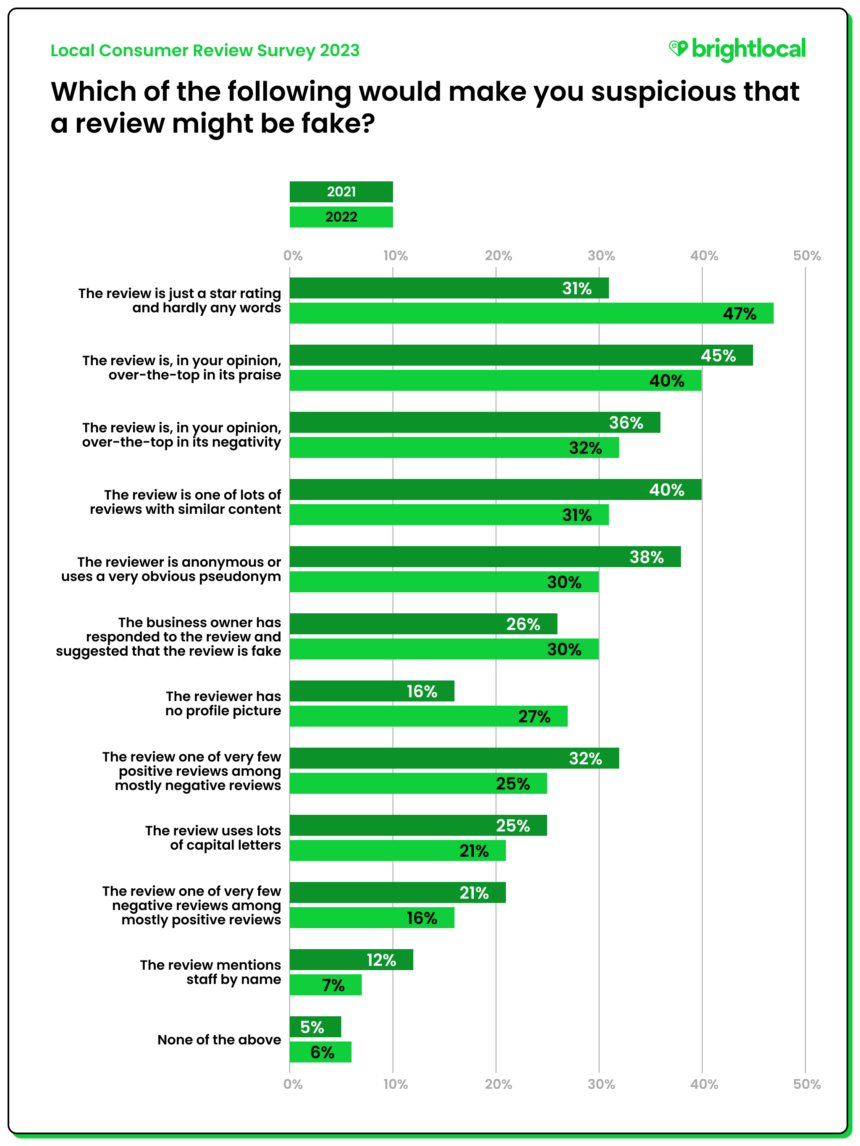
- 47% of consumers said that reviews with just star ratings and hardly any words would make them suspicious that the review was fake, up from 31% in 2022.
- 40% said that over-the-top positivity would make them suspicious of a fake review, while 32% of consumers said over-the-top negativity would make them suspicious that the review content was fake.
The fact that consumers highlighted a lack of detail in reviews as suspicious shows there has been a greater shift toward the importance of written review content. It correlates with our finding that consumers feel positive about reviews where positive experiences are outlined.
Does review incentivization still take place?
Before we delve into this section, I’d like to start with a disclaimer: BrightLocal does not endorse or recommend incentivizing online reviews in any way. It’s an important statement to make because, upon reading various articles on the subject across otherwise respectable publications, there is still plenty of confusion on the topic and marketing personalities encouraging “creative” methods of incentivization.
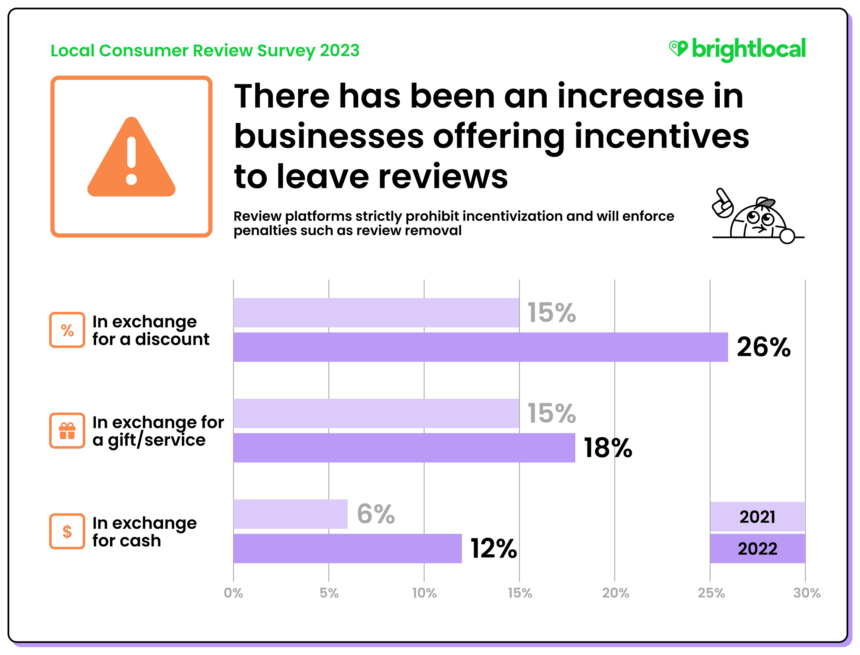
To be clear, any form of incentivization is viewed as bad practice, and, in some cases, you might even get your account flagged publicly as one that engages in it—as seen on Yelp. In September 2022, Google updated its guidelines in a bid to crack down on businesses using incentives to get reviews.
With that terse disclaimer ringing in our ears, then, just how many businesses are still doing it?
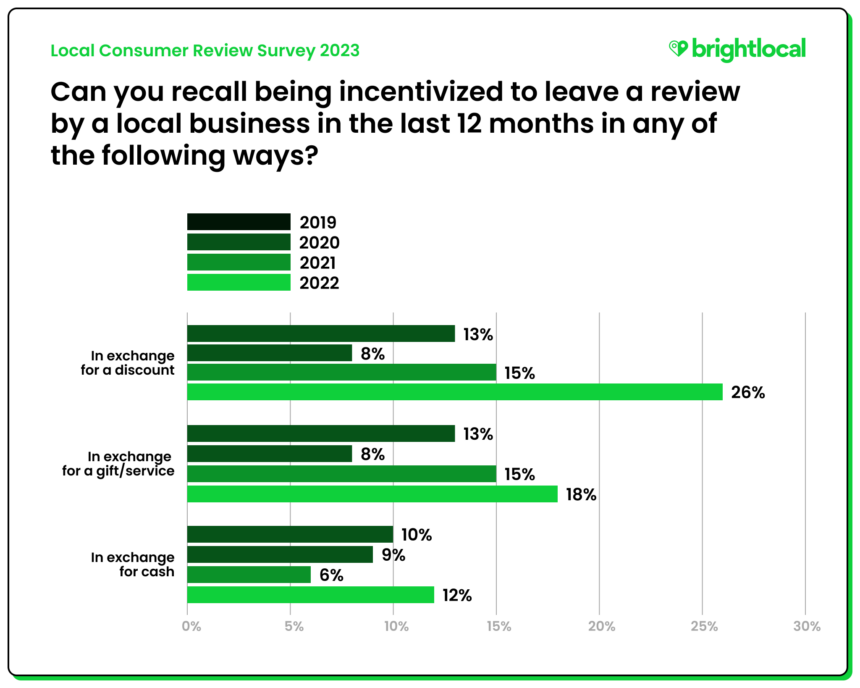
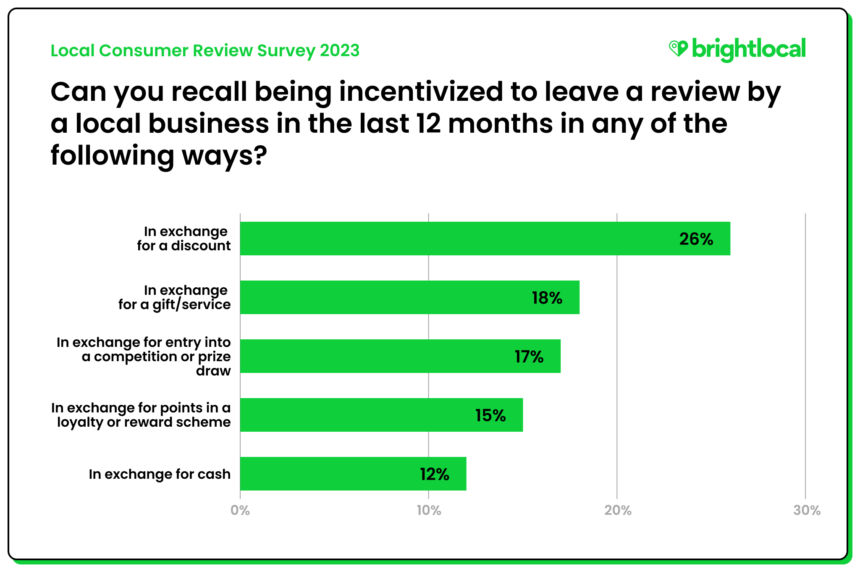
This one was a bit of a shocker! After the percentages of consumers who recalled being offered incentives fell in 2020 (which likely came as a result of the pandemic instead of any moral changes to incentivization) our findings show the practice is still very much alive and kicking. More worrying is the significant increase in consumers being offered cash in exchange for business reviews (from 6% in 2021 to 12% in 2022).
For the first time this year, we also added ‘prize draw entry’ and ‘loyalty points’ as options for incentivization methods. While they may seem harmless or more of a “gray area”, it’s important to note that these methods technically count as incentives for customers as they are being offered something in exchange for leaving a review.
Summary
Apart from a few significant trend changes, our comparable results reflect a similar pattern year on year, so we can assume that what was important to consumers in 2022 is still important today. And we can’t expect too much to change in just a year, right?
What does stick out, though, is that while consumers remain aware of issues with fake reviews, there has been a positive shift in how consumers are engaging with review content. This means not just taking top-level details at face value but judging the detail and feeling confident in spotting fake content. We’ve summarised some key takeaways from this year’s Local Consumer Review Survey for you to consider within your local marketing and review strategies.
Key Takeaways for Businesses
- Email is the most effective way to ask your customers to leave a review, so make sure your emails stand out amongst the fierce competition for your inbox.
- Consumers are more than twice as likely to consider using your business if they can see you actively responding to positive and negative reviews—ensure you take the time to craft authentic responses.
- Consider how review keywords and snippets could work for your business. Is there something that your business is particularly well-known for? Can you get consumers talking about it?
- Consumers are more compelled to write and act upon positive reviews, so assessing where you can be going above and beyond to incite emotional responses within your customers is key.
- 65% of consumers will leave a review at least some of the time if asked, so consider how you can encourage your teams to ask for feedback and send timely requests via email. Don’t ask, don’t get!
- Ensure your business has a presence on video and social channels like YouTube, TikTok, and Instagram, as plenty of consumers go there for business information. Instagram utilizes business information on its maps discovery feature, so check your details are accurate.
Thanks for reading the Local Consumer Review Survey 2023! Tell us what you think—you can tweet us @BrightLocal or leave a comment below.
Methodology and More Information
BrightLocal has been conducting the Local Consumer Review Survey since 2010. We repeat many of the same questions year on year to measure changes in behavior, and occasionally introduce new questions to reflect the continually evolving landscape of consumer reviews.
Sample Considerations
A representative sample of 1,117 US-based consumers was used to conduct the Local Consumer Review Survey in January 2023. The survey was distributed to an independent consumer panel via SurveyMonkey, in which age group breakdowns and gender are balanced.
However, it is significant to note that SurveyMonkey’s consumer panels only consider participants that identify as male or female and therefore do not consider where participants may identify outside of binary genders. Additionally, no consumers under the age of 18 participated in this survey.
Using Our Data
Publications and individuals are welcome to use the survey findings, charts, and data, provided BrightLocal is credited and linked to via this page’s URL. If you have any questions about this year’s report, please contact the content team, or leave a comment below.

