
Table of Contents
Any marketer focused on real inbound lead generation has googled “benchmark for (insert initiative here).” We all want to know what metric to use for measuring success and if we are anywhere close with our marketing efforts.
But as soon as we think we know, the self-doubt starts creeping in. We find ourselves spiraling down the rabbit hole of Google, wondering… “should I be comparing my lead to opportunity rate to other SaaS platforms or is it different for a professional service firm?” or “If my close rate is good but I don’t have any leads, what does that mean?” and of course we end up at… “How the h-e-🏒-🏒does anyone get that many email opens?? ”
We have enough on our plates figuring out what metric we should be measuring, never mind how we know if that metric is, in fact, good once we measure it. 😥
What are the right metrics?
We put our heads together and created this post that includes ONLY the metrics we think you NEED TO KNOW. The most important numbers to keep an eye on month over month are those related to the lead generation funnel. These numbers are critical because of the amount of information conveyed in just one visual. Let’s break it down.
On the left are industry average benchmarks for a lead traveling through the funnel. On the right is an example of the conversion rates per stage for Company A.
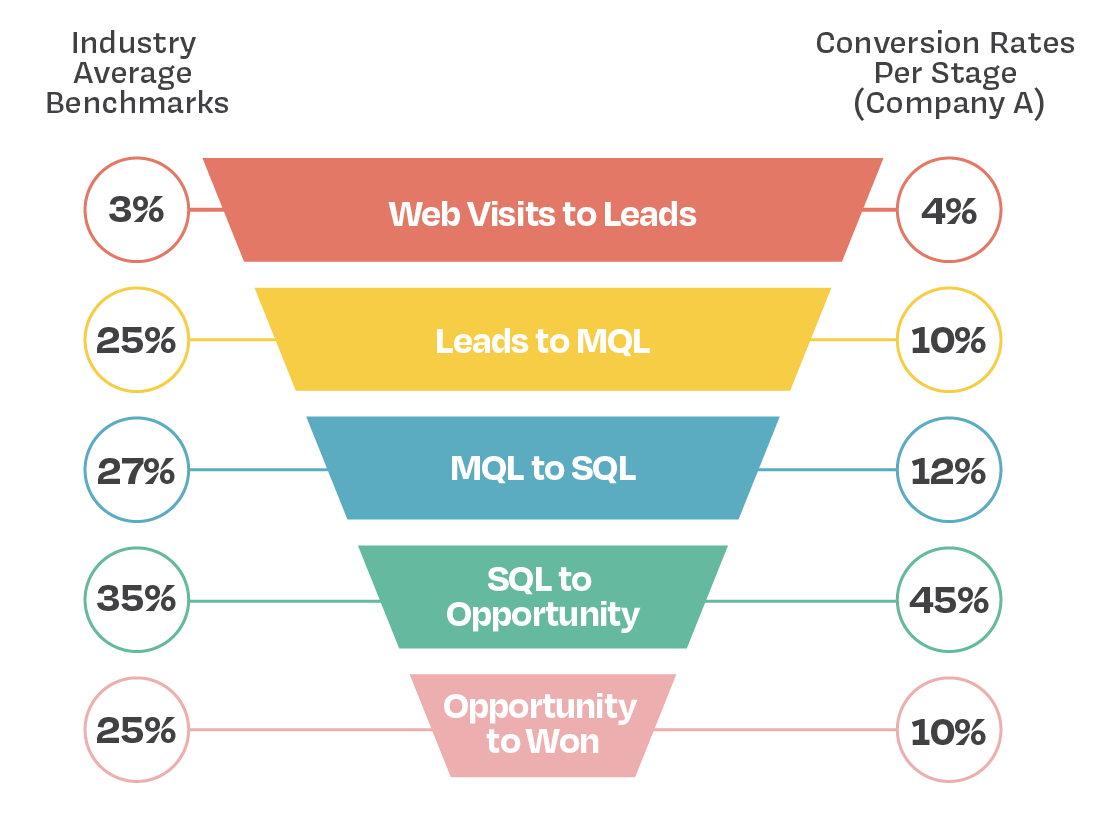
Comparing these two funnels here’s what I know about Company A just going down the funnel:
- The website is capturing leads ✅
- Those leads are not highly qualified based on the low conversion rate to MQL ❗
- Similarly, the low conversion rate from MQL to SQL indicates a gap in content for the consideration stage on this website ❗
- Those who are qualified to start, OR find the information they need, have a high probability of requesting a proposal ✅
- There’s additional optimization to be made in the closing process 🤔
This one chart identifies so many direct actions required to make an impact on the bottom line. Imagine capturing this data for one channel month-over-month. The incremental improvements possible with this data alone provide significant opportunties for improved conversion rates.
For those who need a little more context in what each stage is, the information below will offer some general benchmarks and information to get you started.
Conversion Rate Benchmarks for the B2B Inbound Marketing Funnel
Below are the average conversion rates for a B2B marketing funnel. You can generally swing that average up and down 5 points for a range as explained below.
.png?width=869&height=737&name=lbm-benchmark-conversion-rates-industry-average-benchmarks%20(1).png)
Web visits to Leads: The conversion rate for web visits to leads can vary widely, but a common benchmark is around 2–5%.
Leads to MQLs: The conversion rate for leads to MQLs can also vary depending on the quality of the leads and the criteria used to identify MQLs. A benchmark conversion rate is around 20–30%.
MQLs to SQLs: The conversion rate for MQLs to SQLs is typically higher than for leads to MQLs, as MQLs have already been identified as having a higher potential to become paying customers. A benchmark conversion rate is around 25–30%.
SQLs to Opportunities: The conversion rate for SQLs to Opportunities can vary depending on factors such as the sales team’s skills and the competitiveness of the market. A benchmark conversion rate is around 30–40%.
Opportunities to Won: The conversion rate for Opportunities to Won can also vary depending on factors such as the size and complexity of the deal. A benchmark conversion rate is around 20–30%.
For those who are thinking that general benchmarks would never work for your super niche industry, don’t let it stress you out. These broad conversion rates are a great starting point as you could see in the example provided at the beginning of this blog. Once you get your own data you can hone into optimizing what you have and starting a process of continual improvement.
Factors That Influence The Average
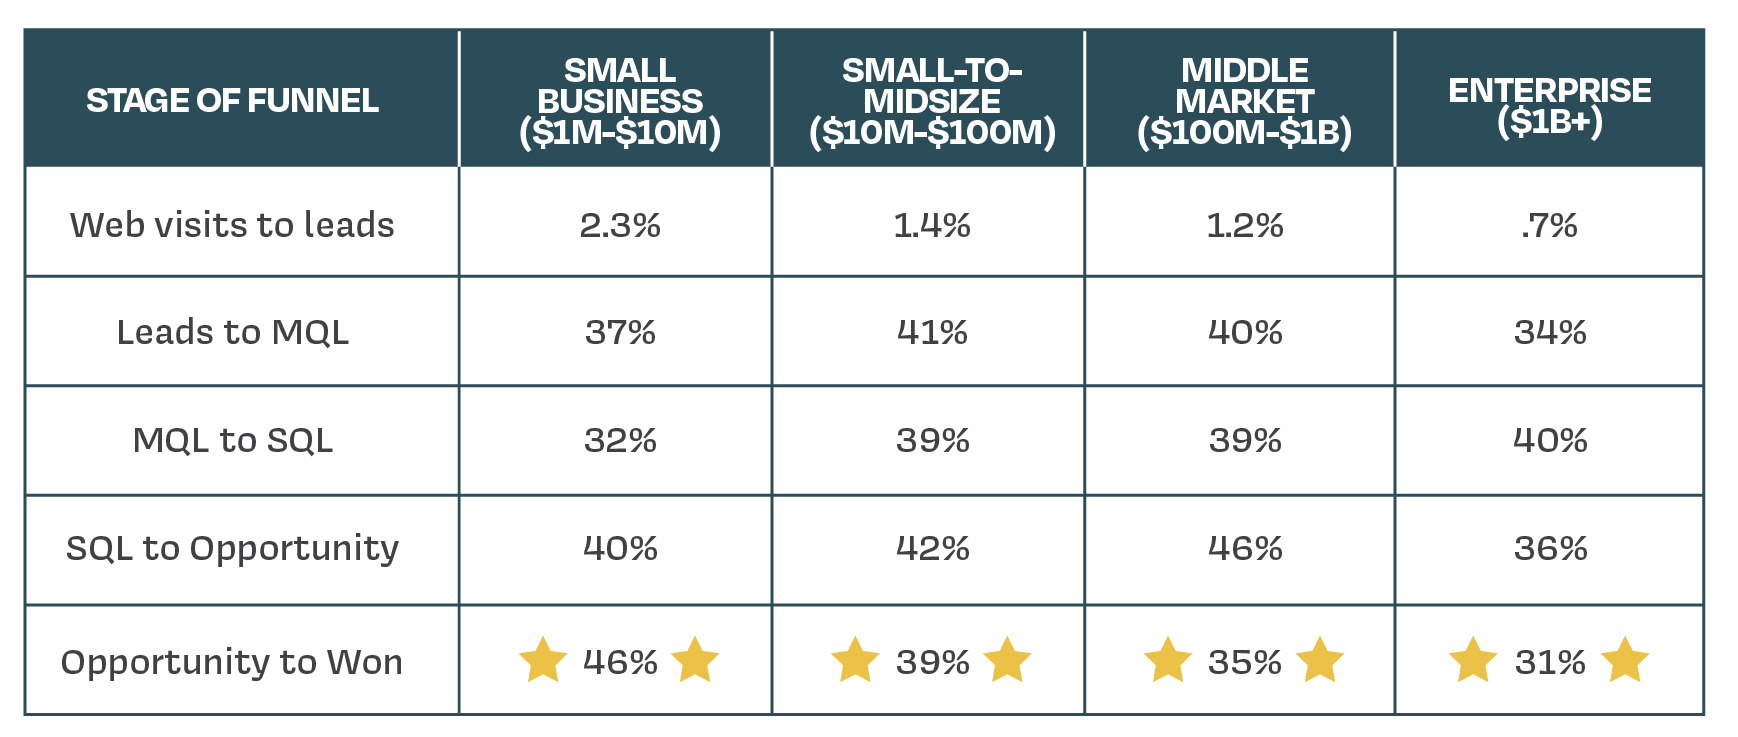
As mentioned, there are a lot of variables that play into an average conversion rate. Specifically, things like industry, average customer value, and size of the business can play a role in every metric when it comes to marketing. So for you diehards who want to know how you stack up to some similar organizations, we pulled a few benchmarks that can offer some context for your KPIs.
Let’s look at how the size of your business can impact your conversion rate.
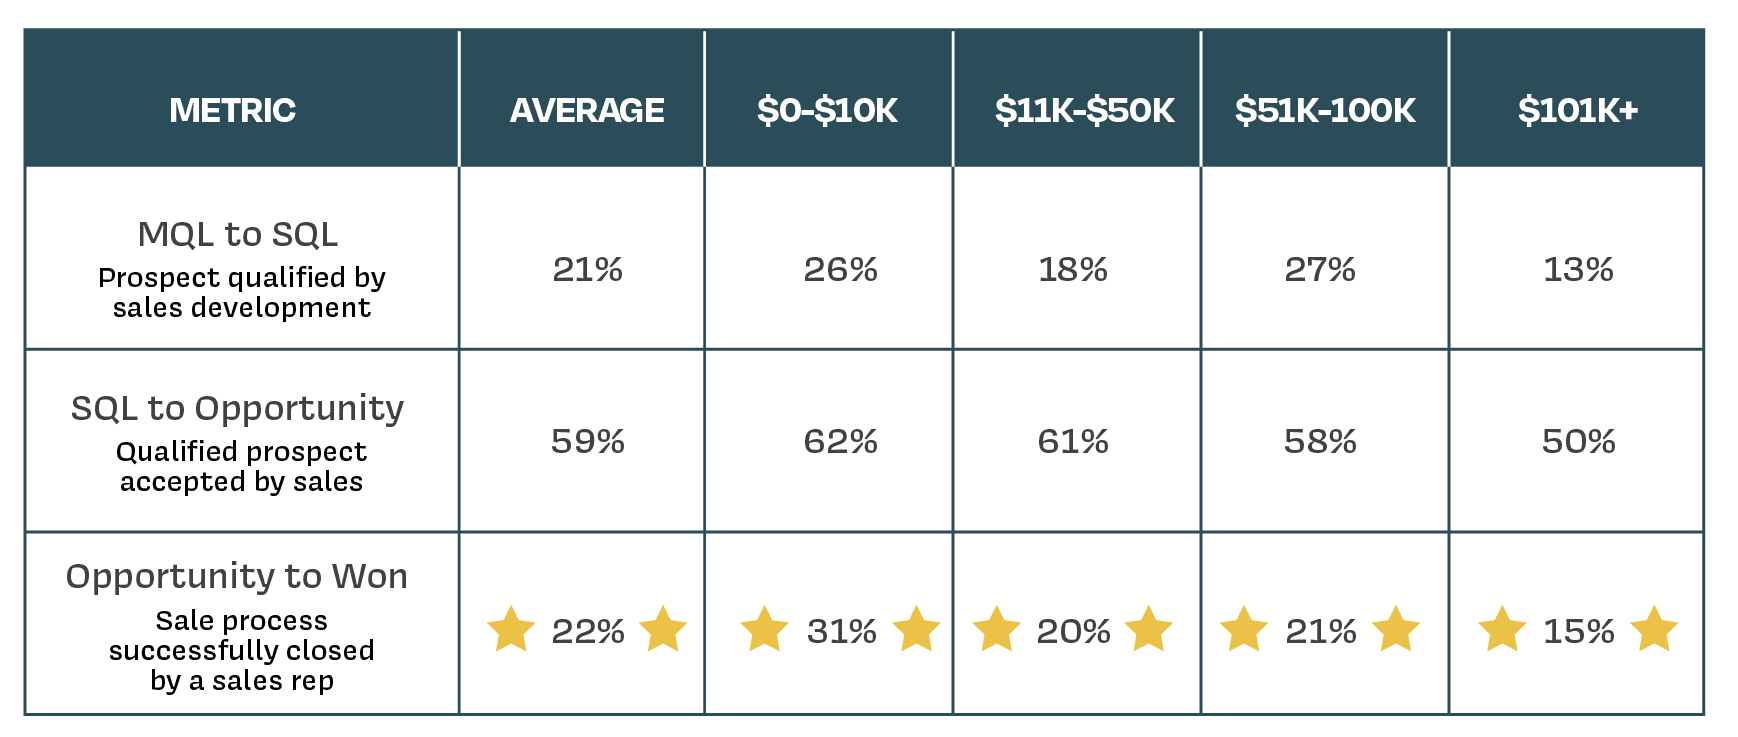
The below chart demonstrates how your average customer value can impact the conversion rate.
At the end of the day, it doesn’t matter if you have the exact benchmark to compare yourself. What matters is that you are tracking at all. Over time, you will get a clear picture of what a good conversion rate is for your company and have the data to make meaningful changes and material impact.
Resources:
https://firstpagesage.com/seo-blog/lead-to-mql-conversion-rate-benchmarks-by-industry-channel-fc/
https://www.gartner.com/en/articles/sales-development-metrics-assessing-low-conversion-rates
